Climate Risks to Complex Sytems


Lecture

Mon., Jan. 29

I was asked to share the following with you:

We are looking for people who are concerned by the state of the environment and who want to do something about it. Our yearlong program has prepared recent college graduates for 30 years to launch a career in environmental organizing and advocacy by providing hands-on experience running campaigns with groups like the Wilderness Society, Endangered Species Coalition, Mighty Earth and more. We then connect our graduates to jobs in the environmental and social change movement.

Contact Amelia Farrell 410-934-9033 amelia@greencorps.org
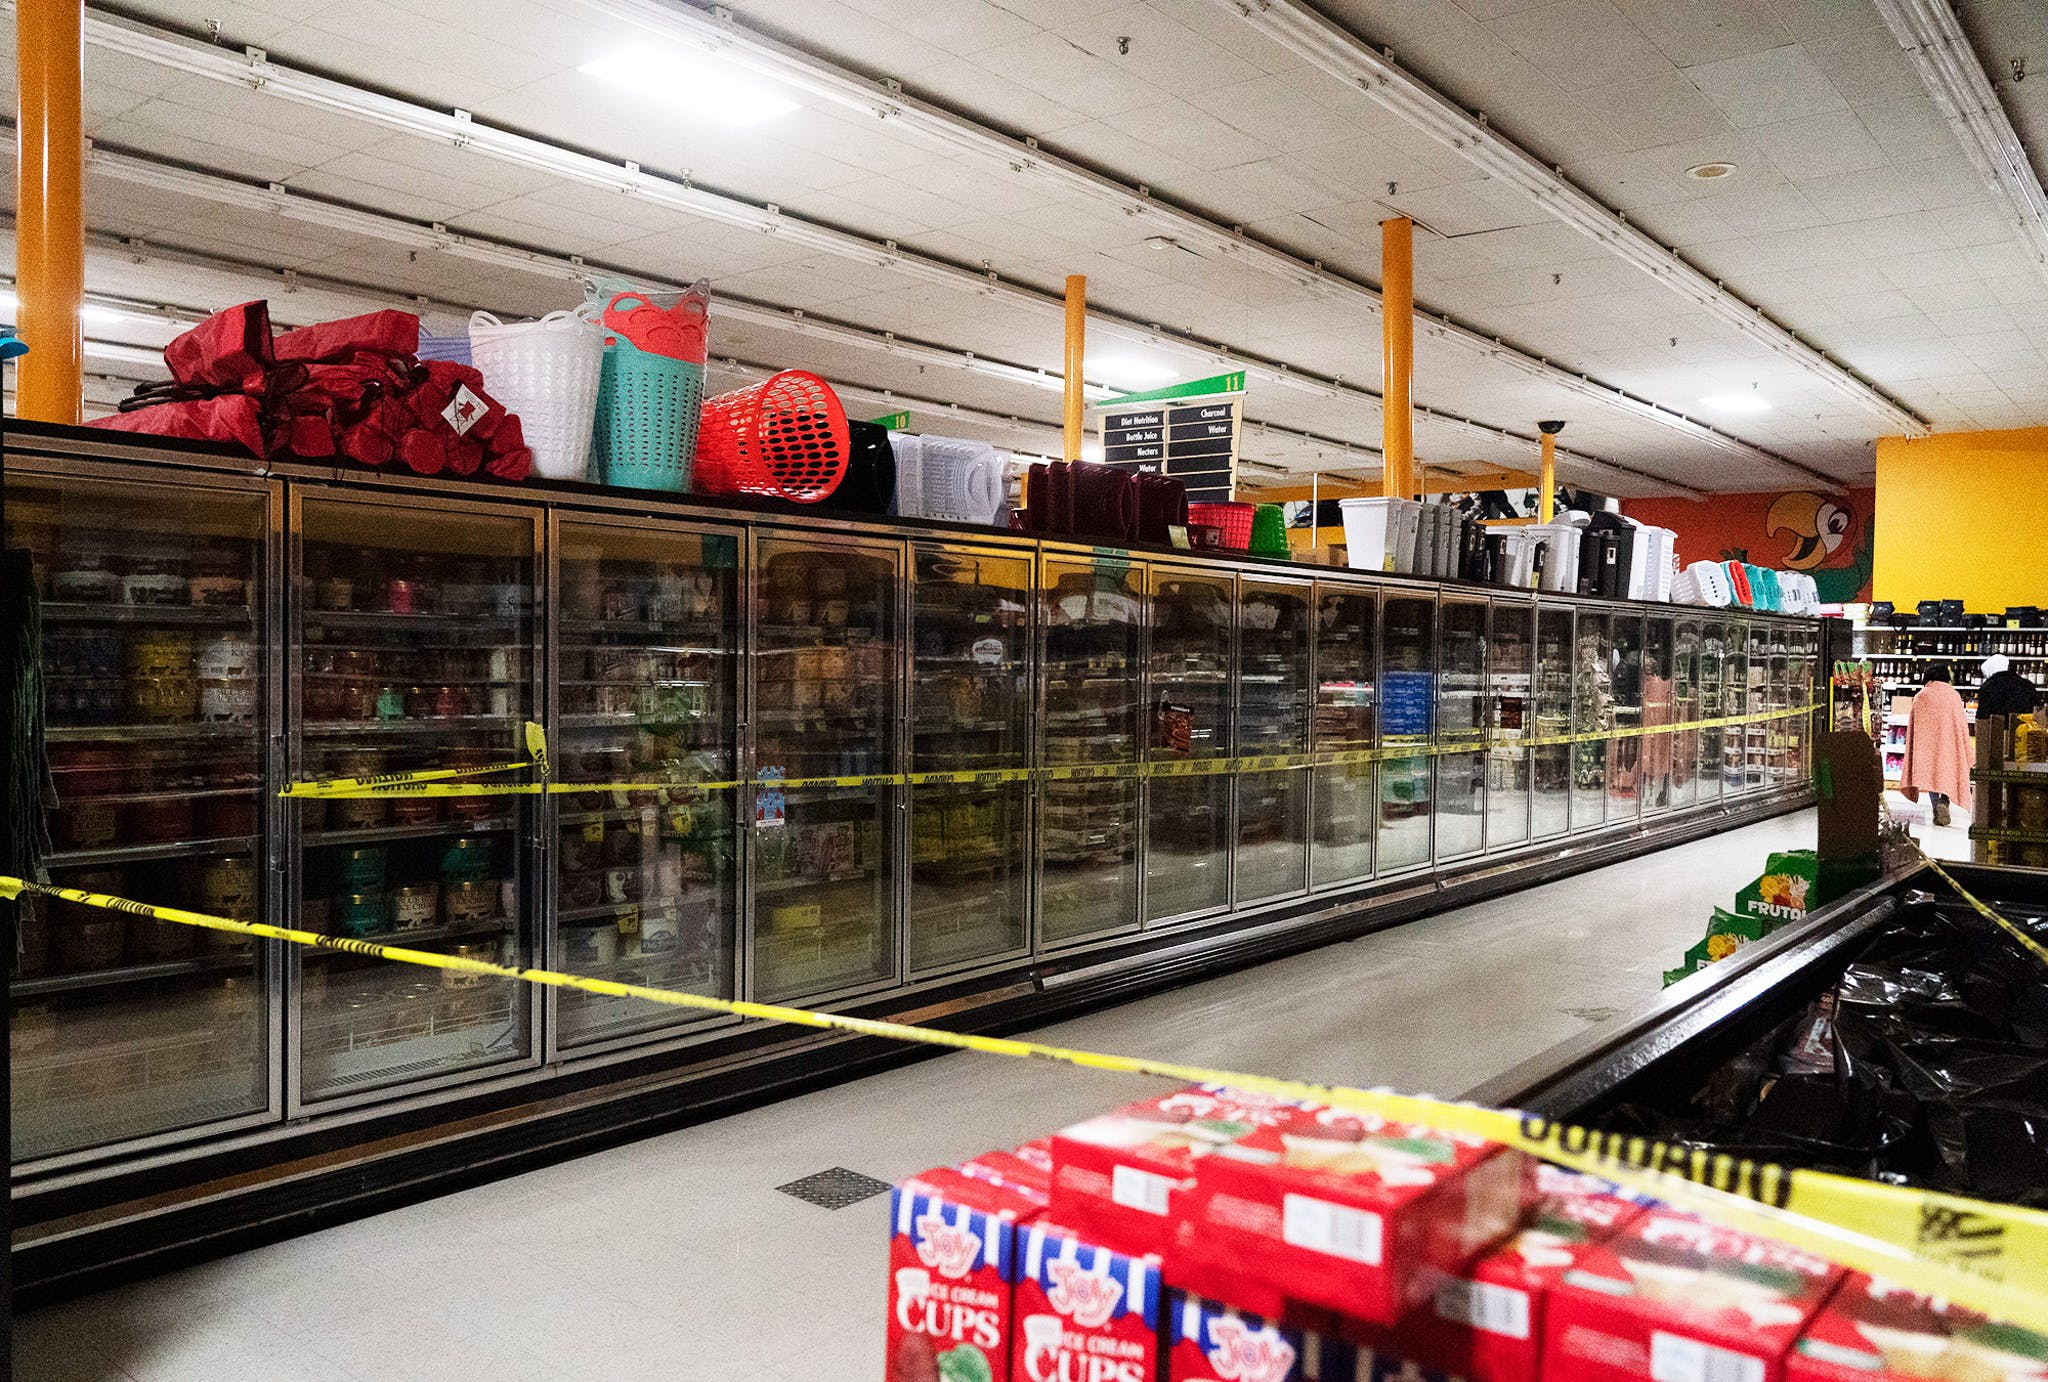
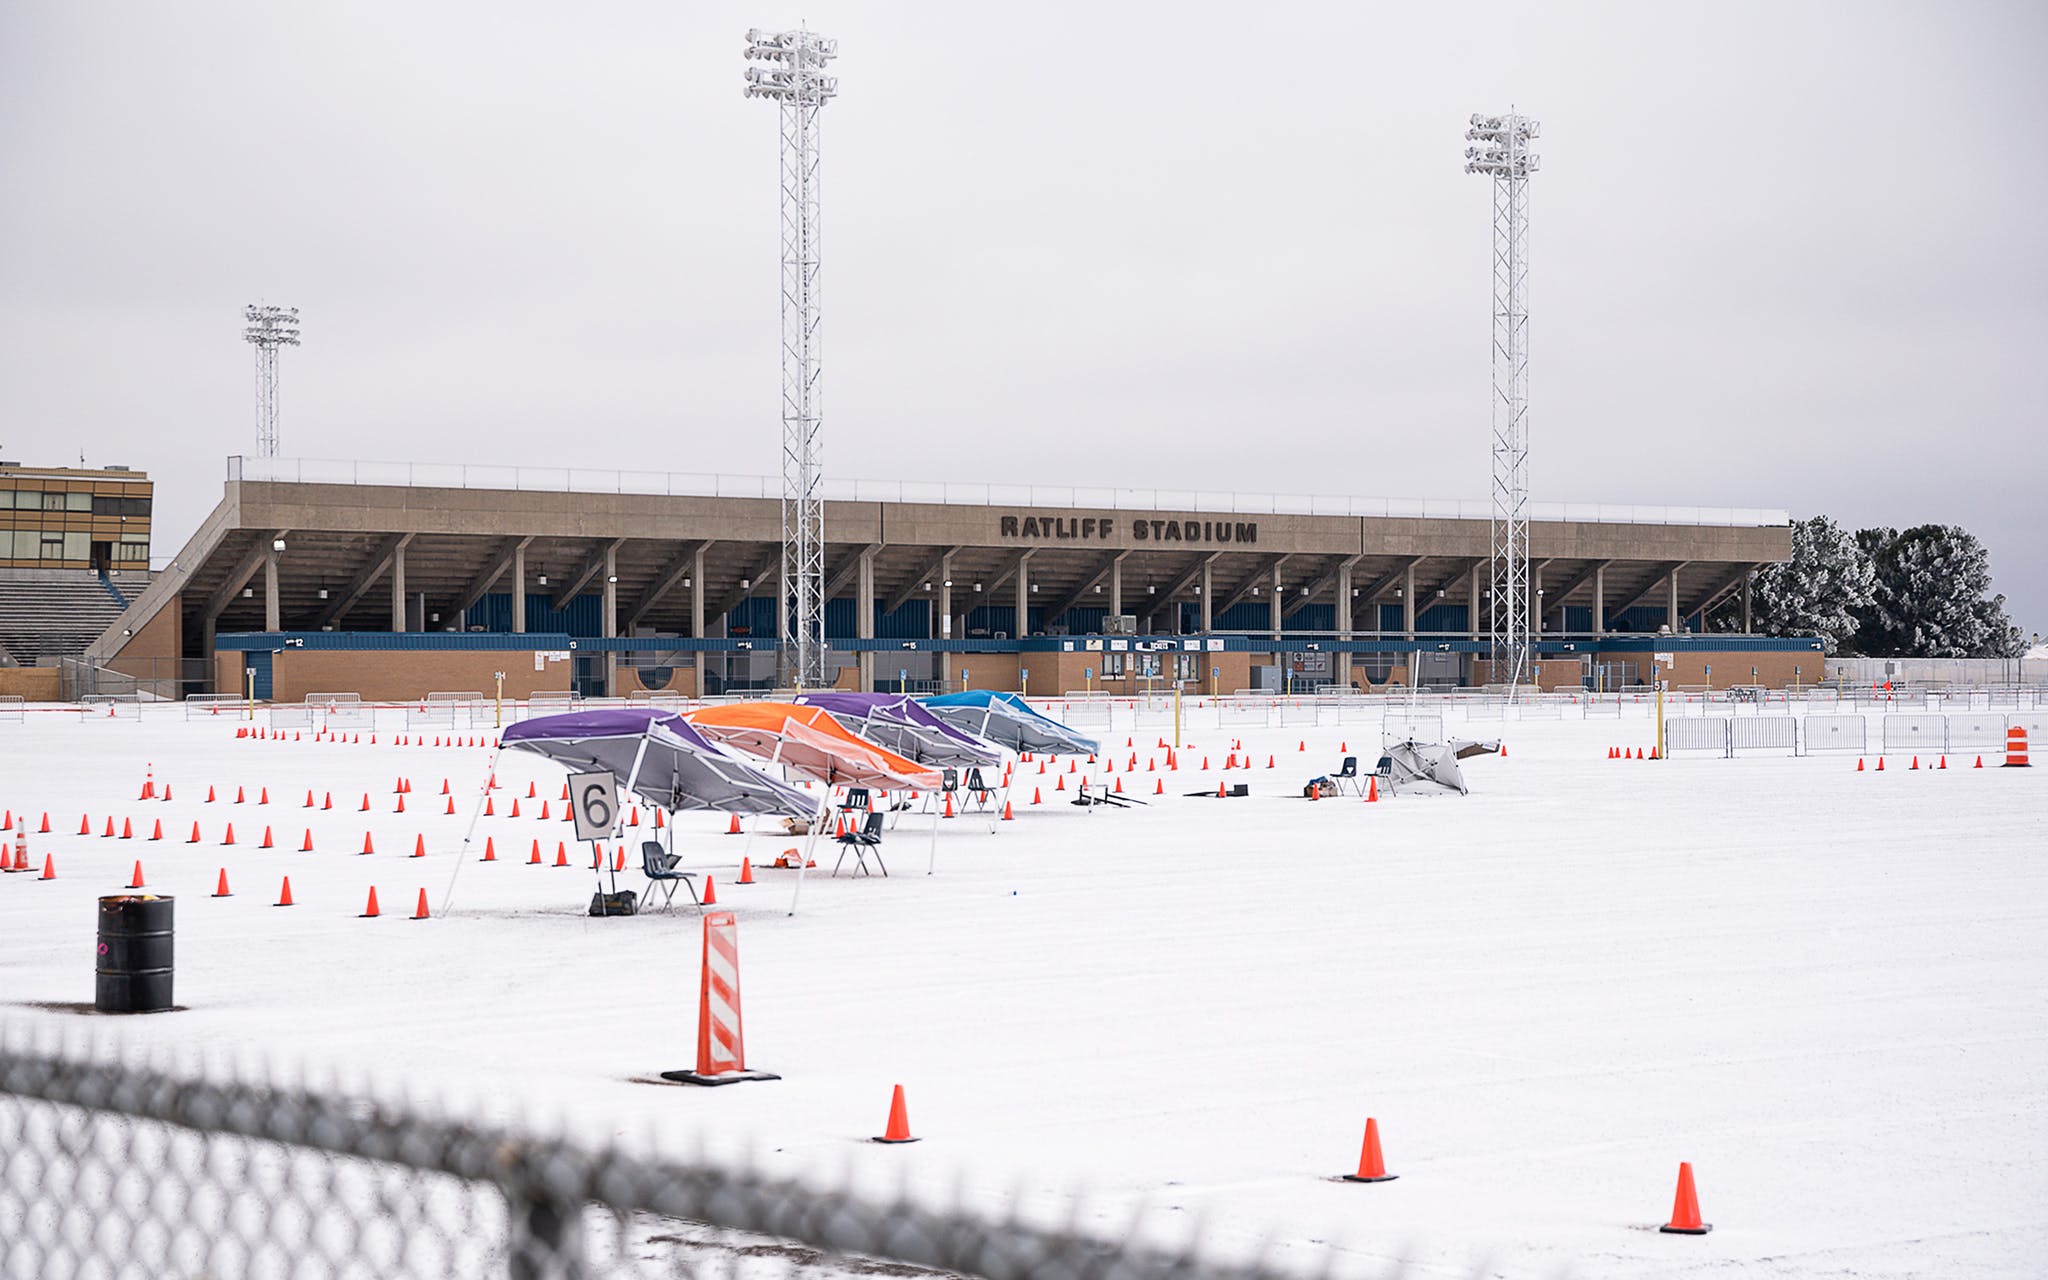
Today

Moving forward, we’ll focus largely on decision frameworks for analyzing climate risks. We’ll generally use simple systems for interpretability! However, many of the same principles apply to complex systems.

Today, we’ll look at climate risks to complex systems through a case studies. On Wednesday, we’ll read Reed et al. (2022) to ground ourselves in the bigger picture.

2021 Texas Freeze

Today

  1. 2021 Texas Freeze

  2. Demand for heating

  3. Electricity supply

  4. Wrapup

Cascading failures

Interconnected and interdependent infrastructure systems

Figure 1: 📷: Nakamura / Getty Images; Landis / AP; Odessa / AP; JDG.

Skillful weather forecasts

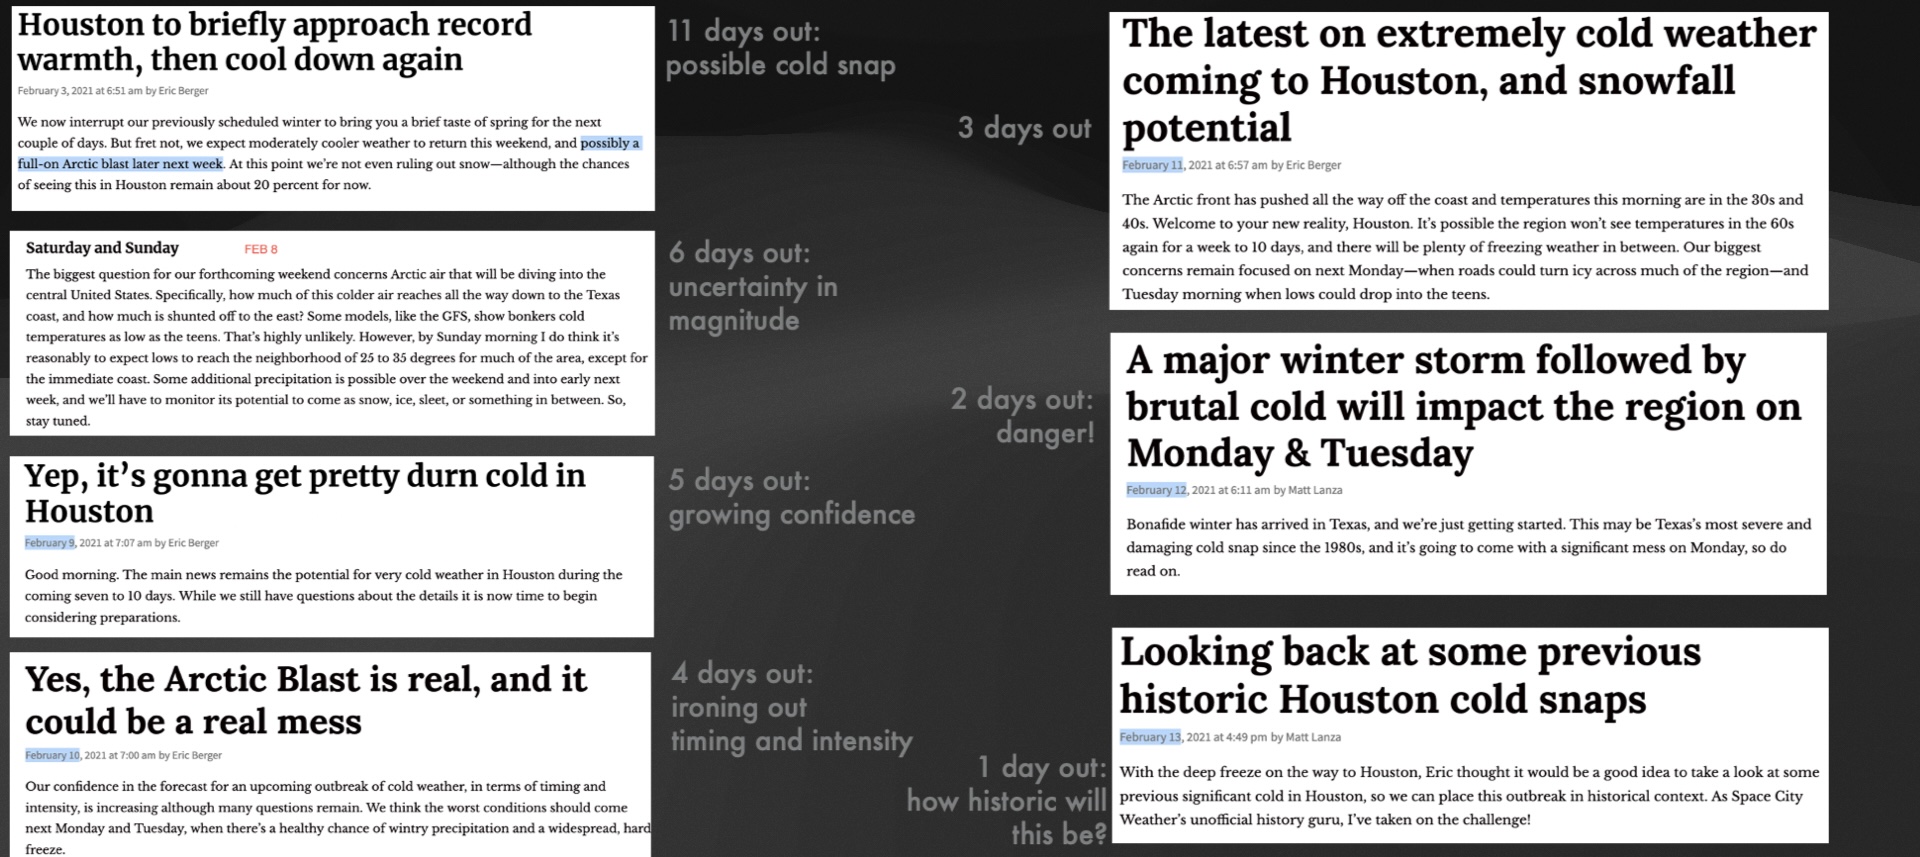
Figure 2: spacecityweather.com/

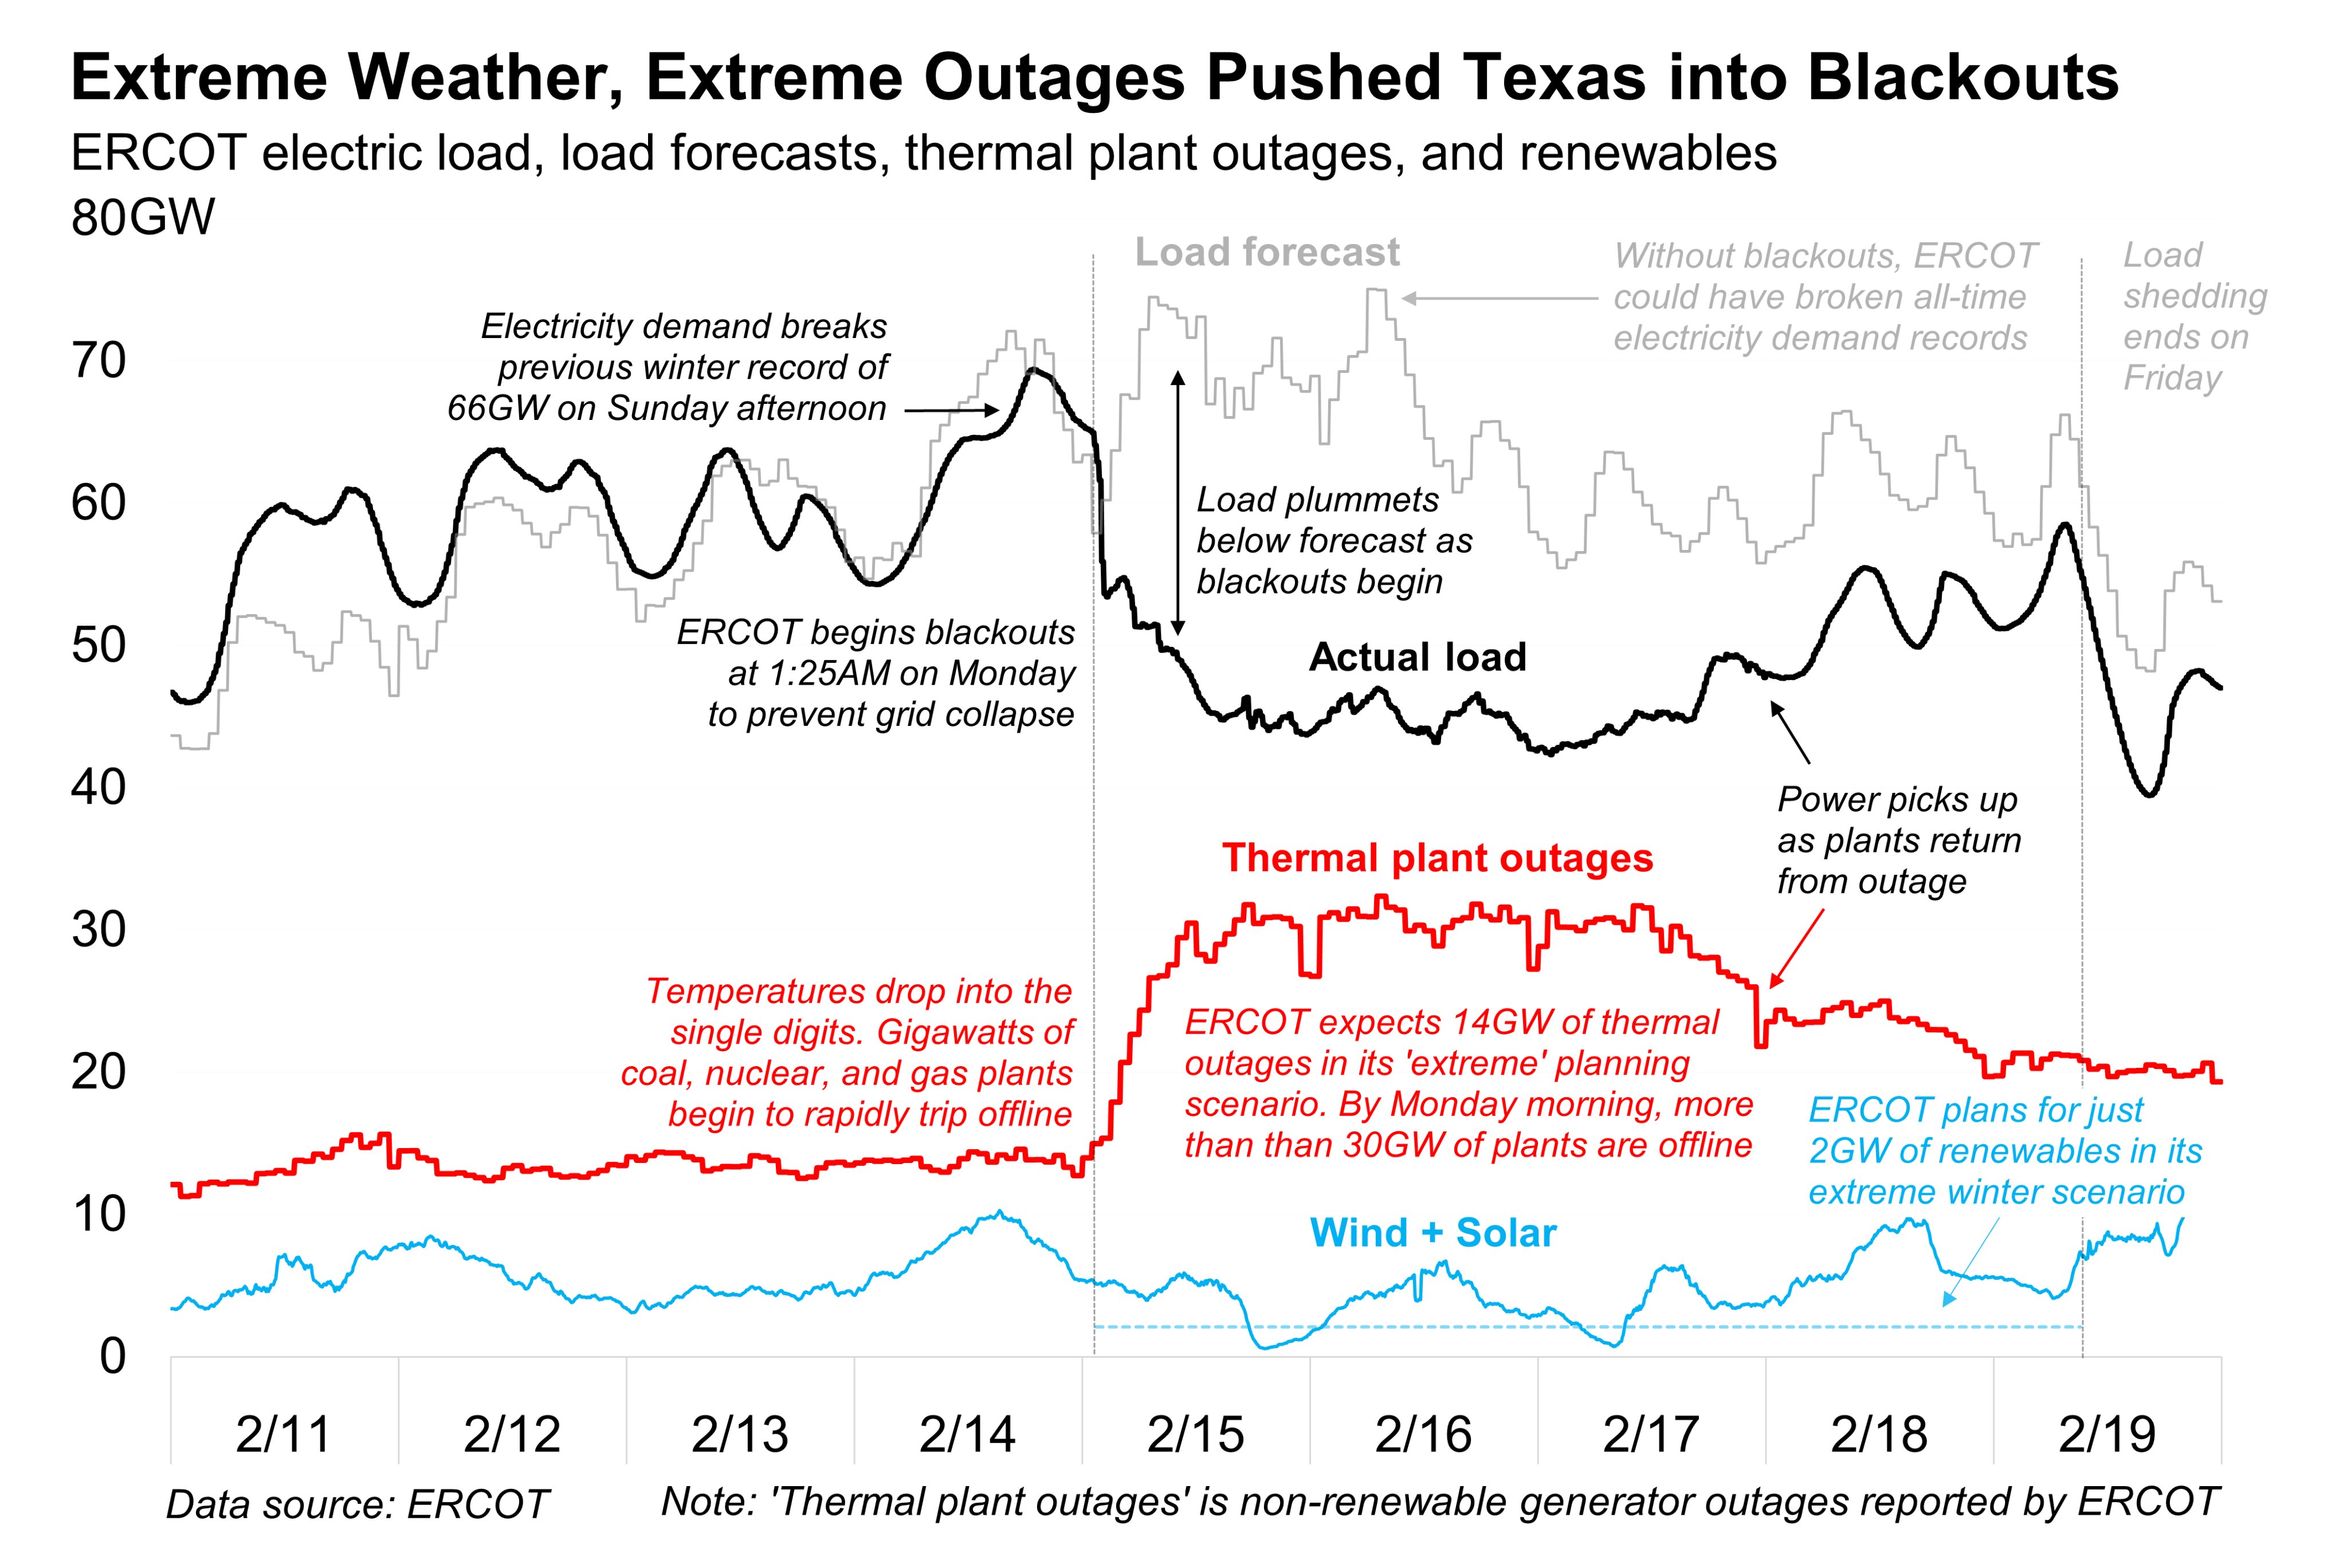
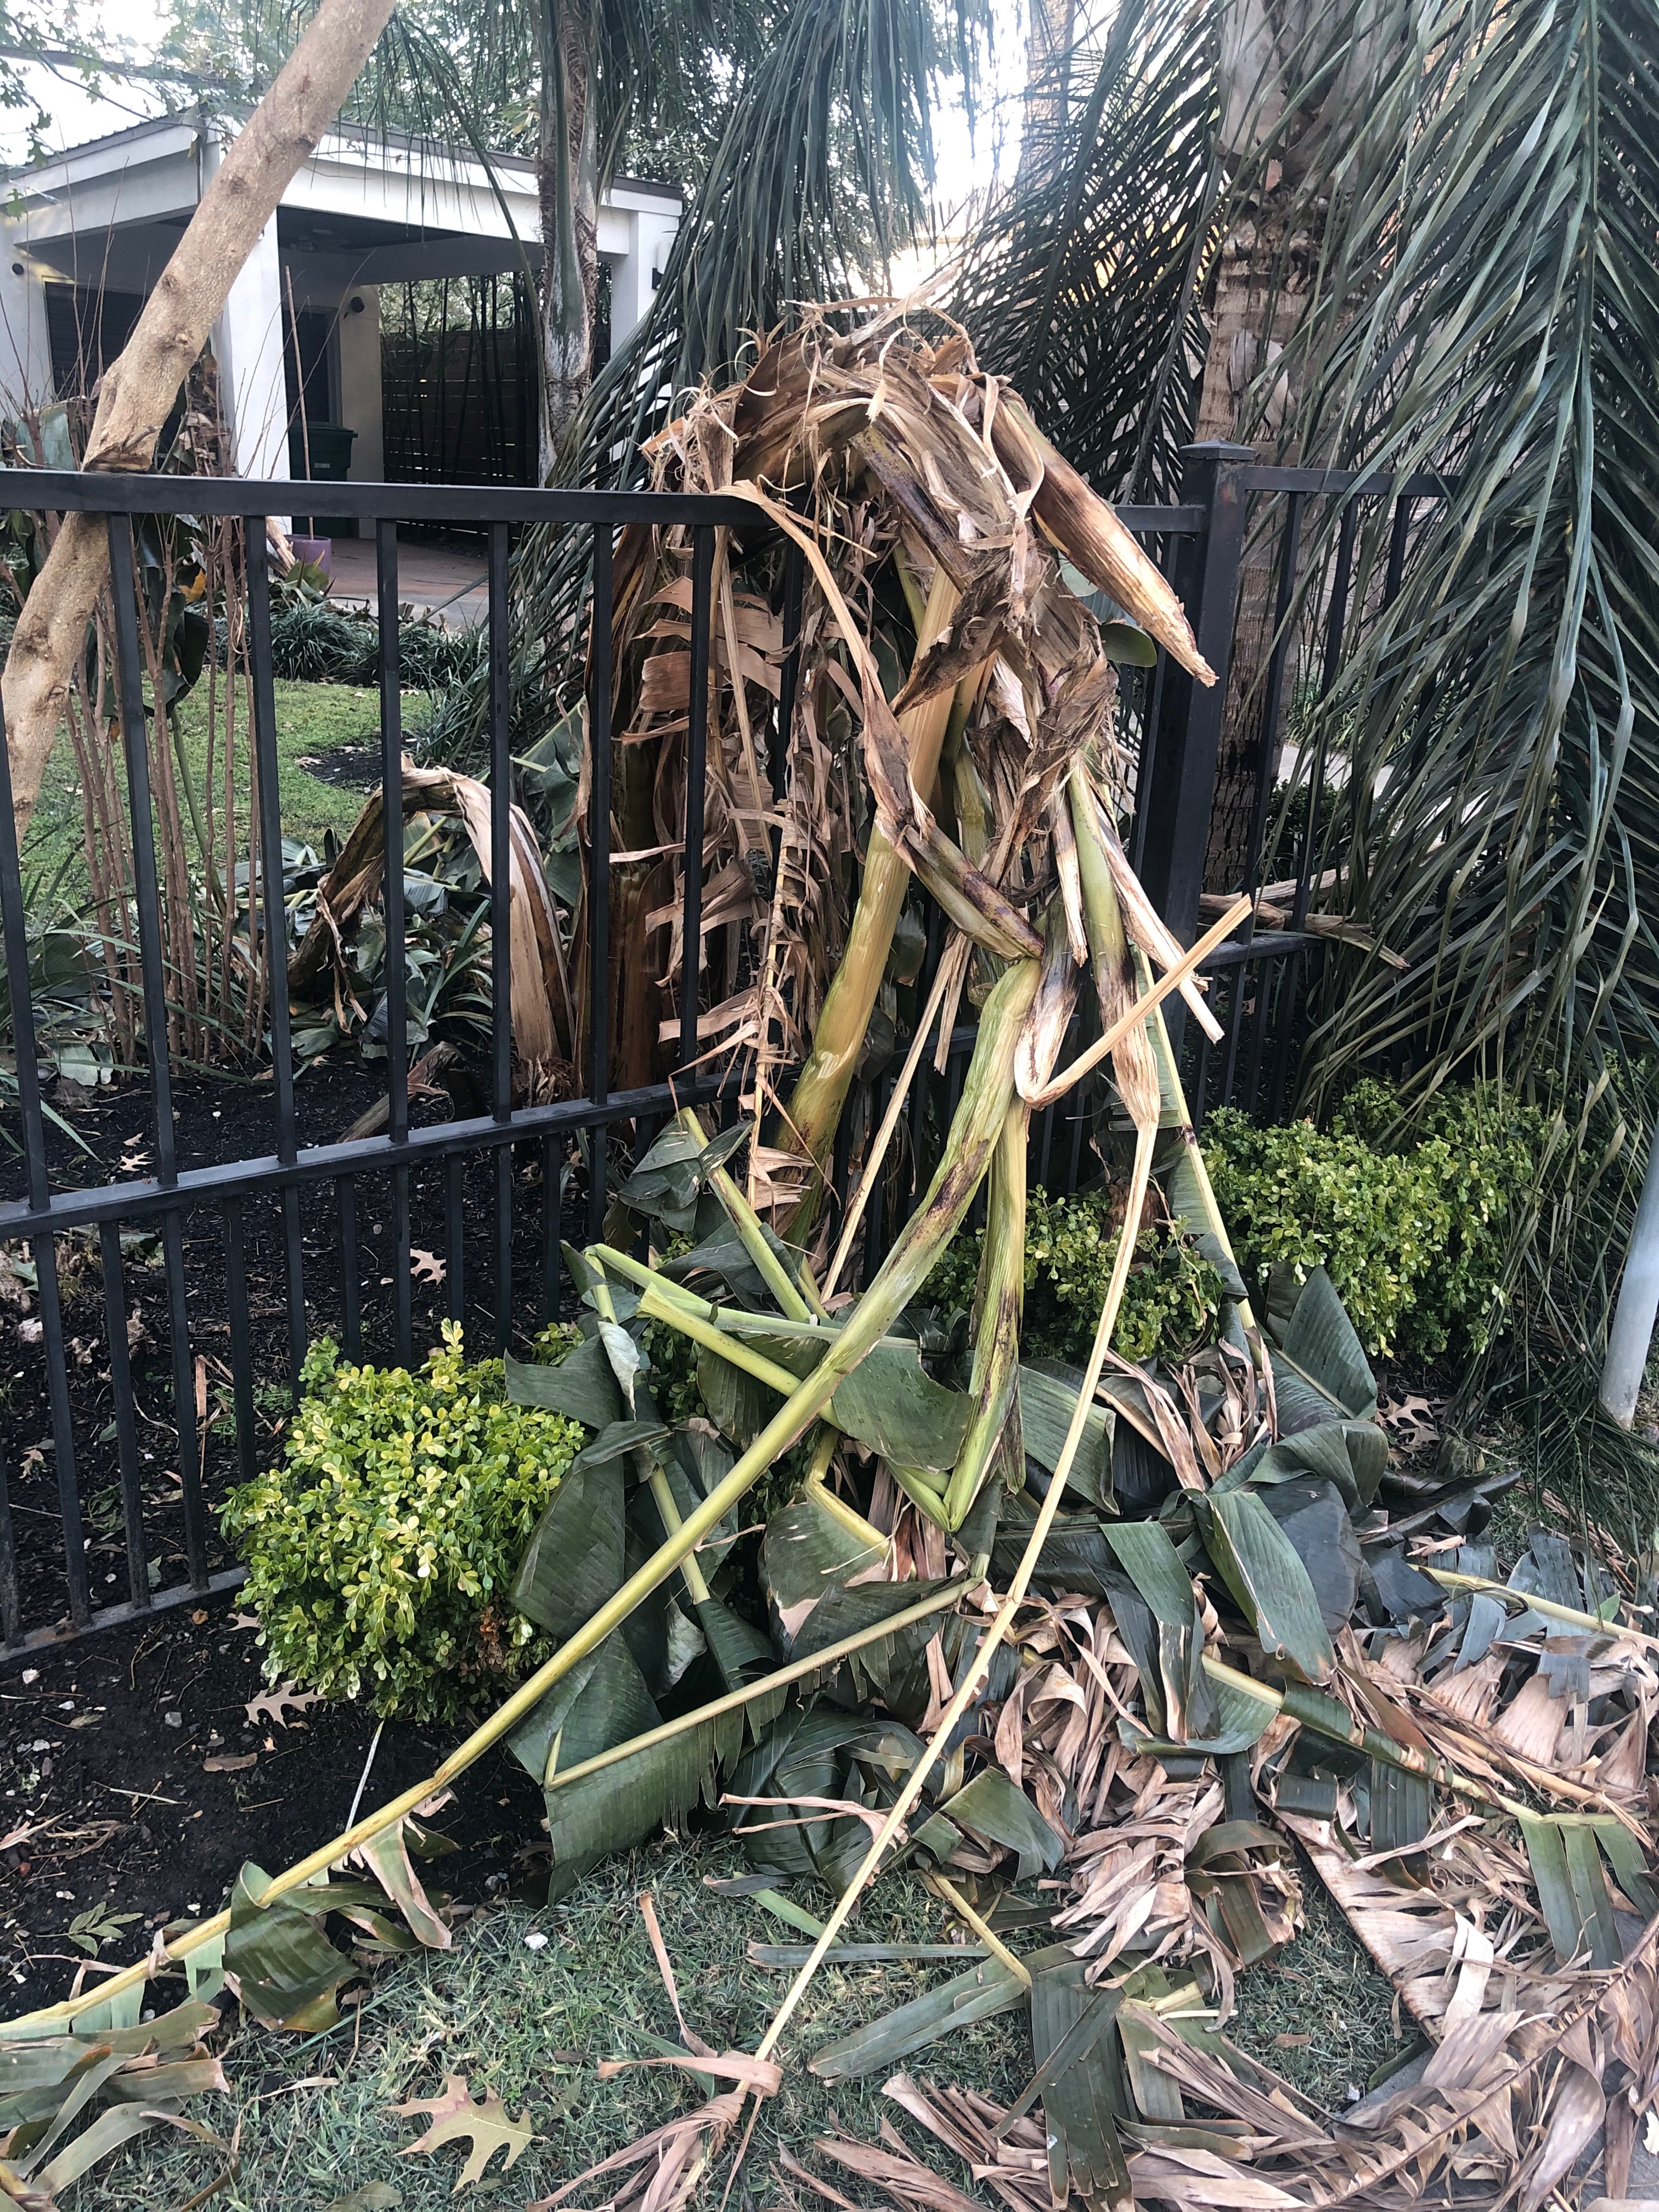
Figure 3: 📷: Bryan Bartholomew on Twitter.

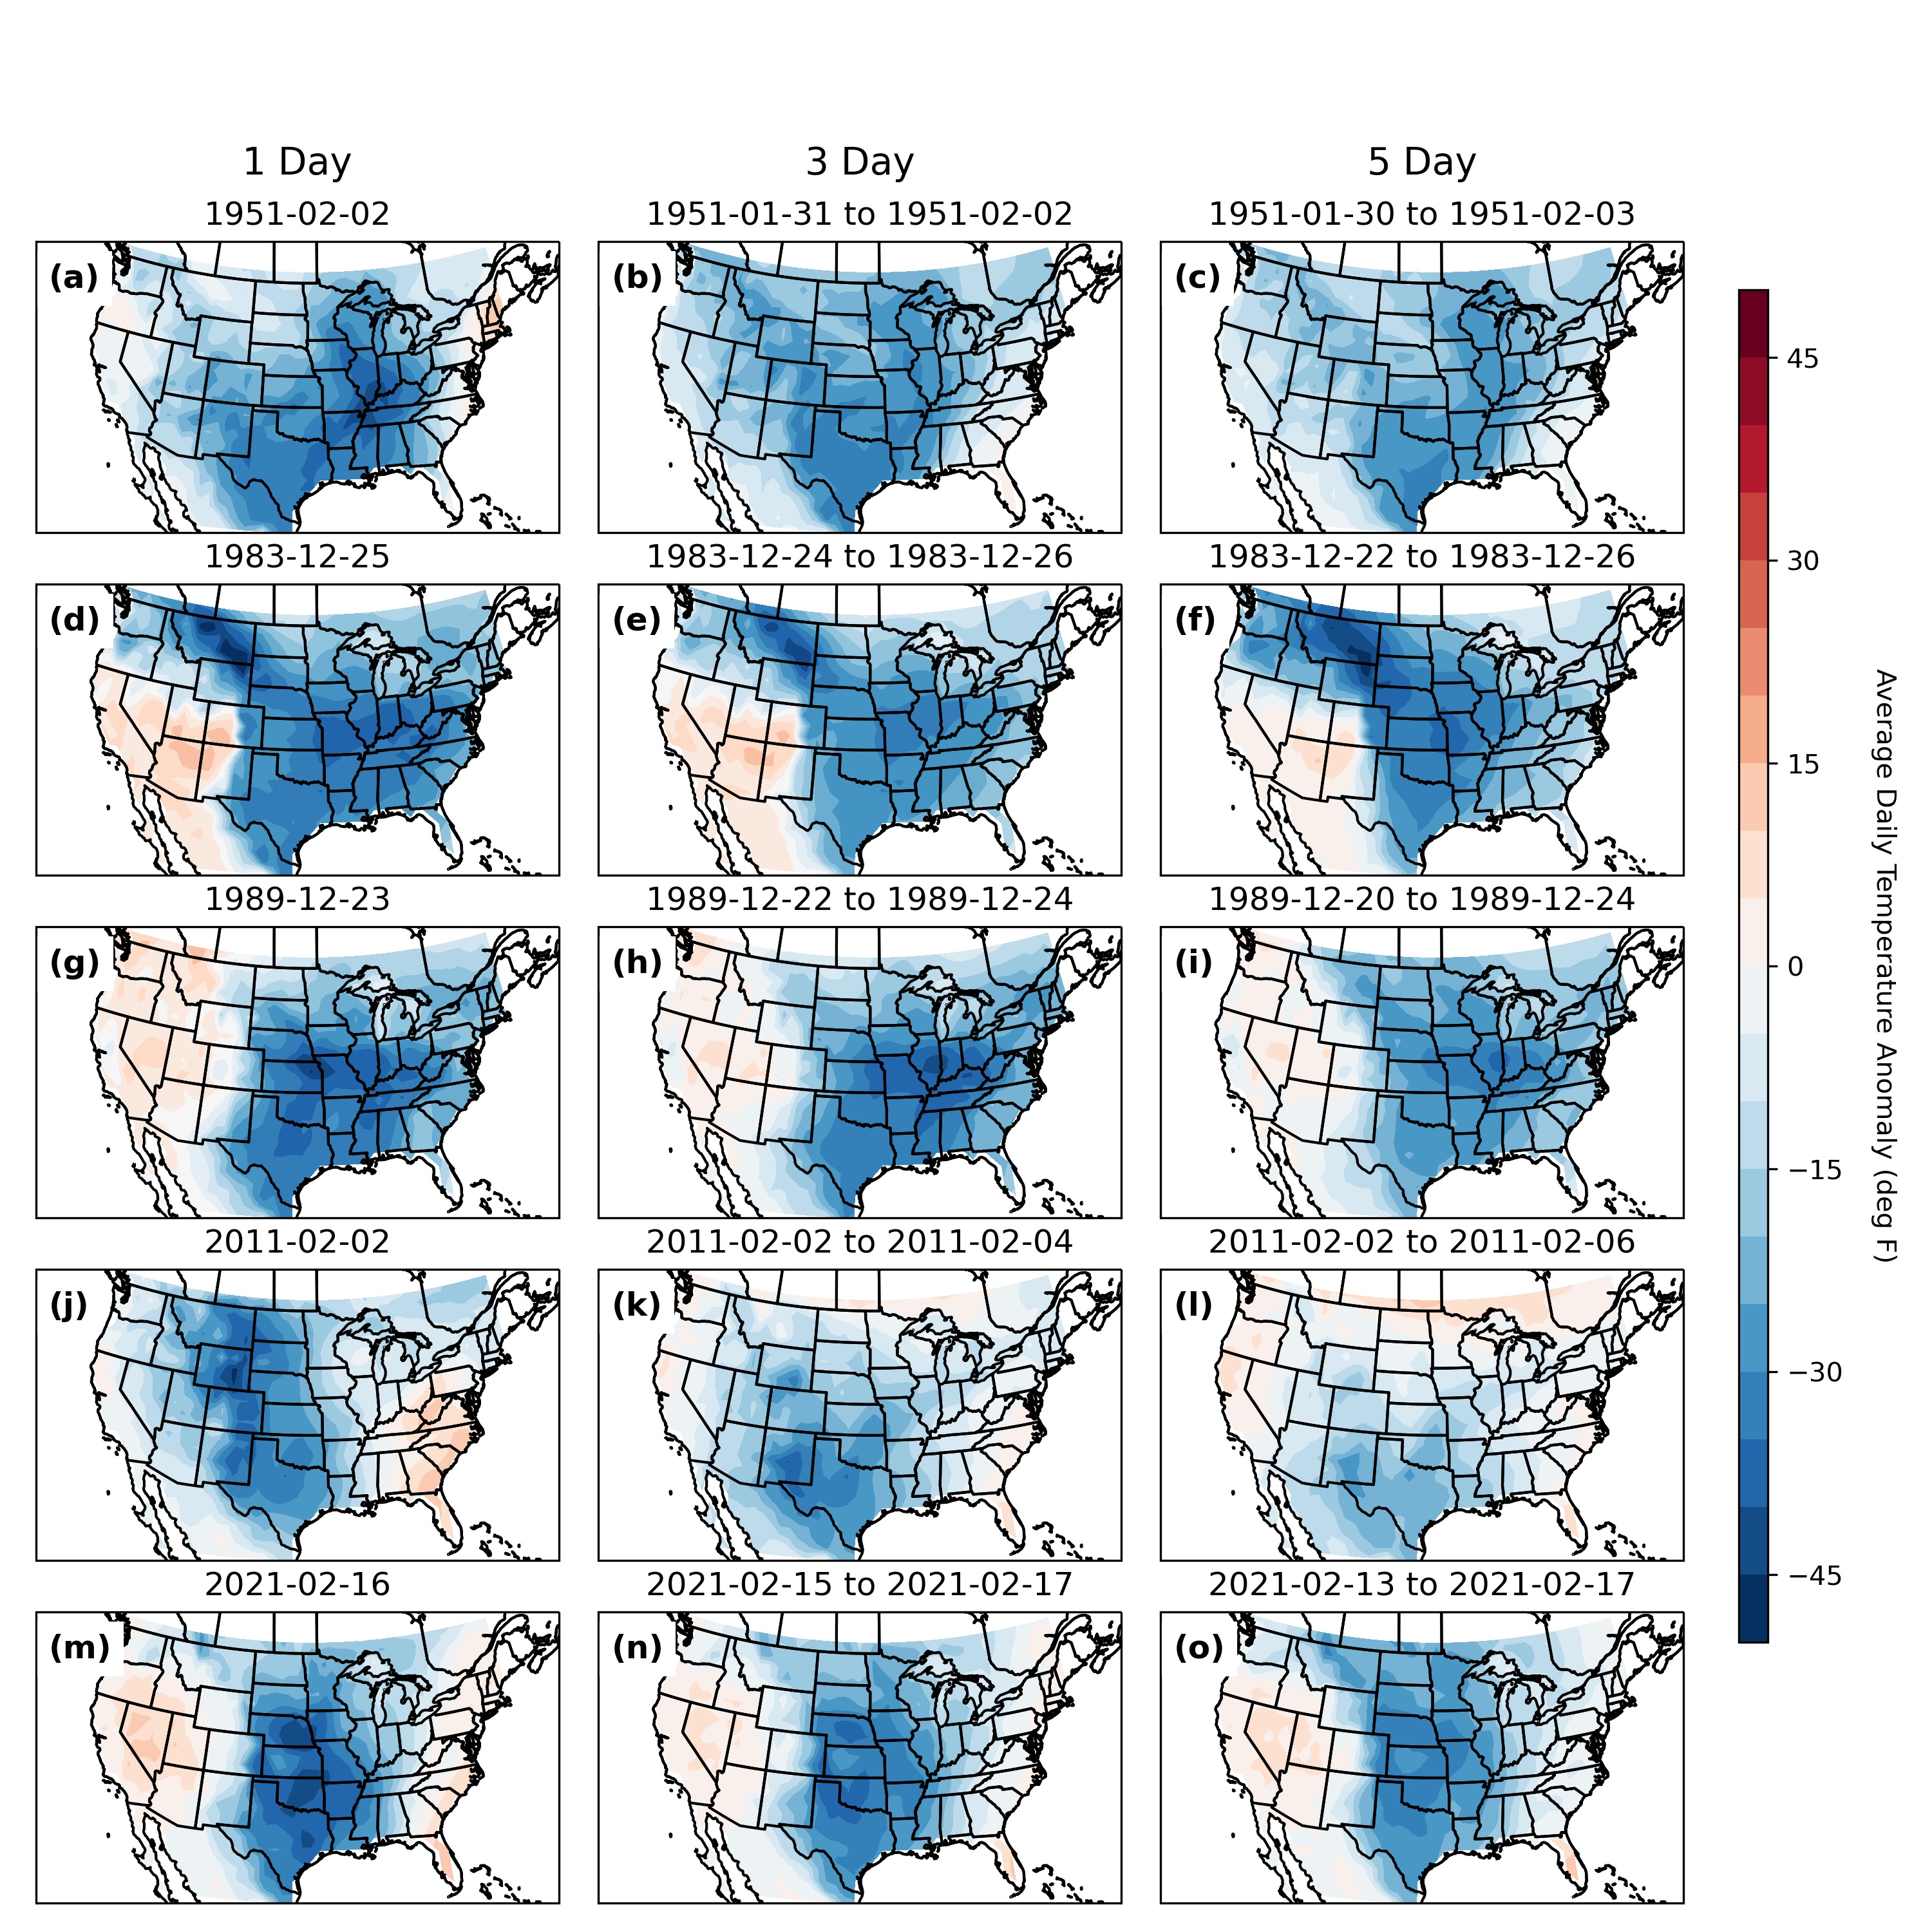
Were these temperatures unprecedented?

  1. Use observations only
  2. Look globally and regionally
  3. Past temperatures were lower / comparable

How else can we explore hazard?

Figure 4: Doss-Gollin et al. (2021)

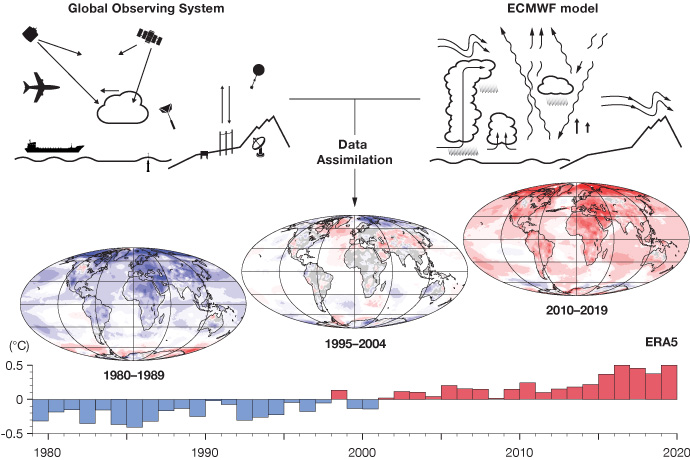
Quick aside: ERA5 reanalysis

  1. We want data on past weather
  2. Observations are unevenly distributed, and come with errors
  3. Reanalysis: fills in gaps in observational record, in a way that is consistent in time / physical laws
  4. ERA5: a premier reanalysis product
Figure 5: A schematic of the ERA5 reanalysis process

Demand for heating

Today

  1. 2021 Texas Freeze

  2. Demand for heating

  3. Electricity supply

  4. Wrapup

Figure 6: Fig 2a of Doss-Gollin et al. (2021)

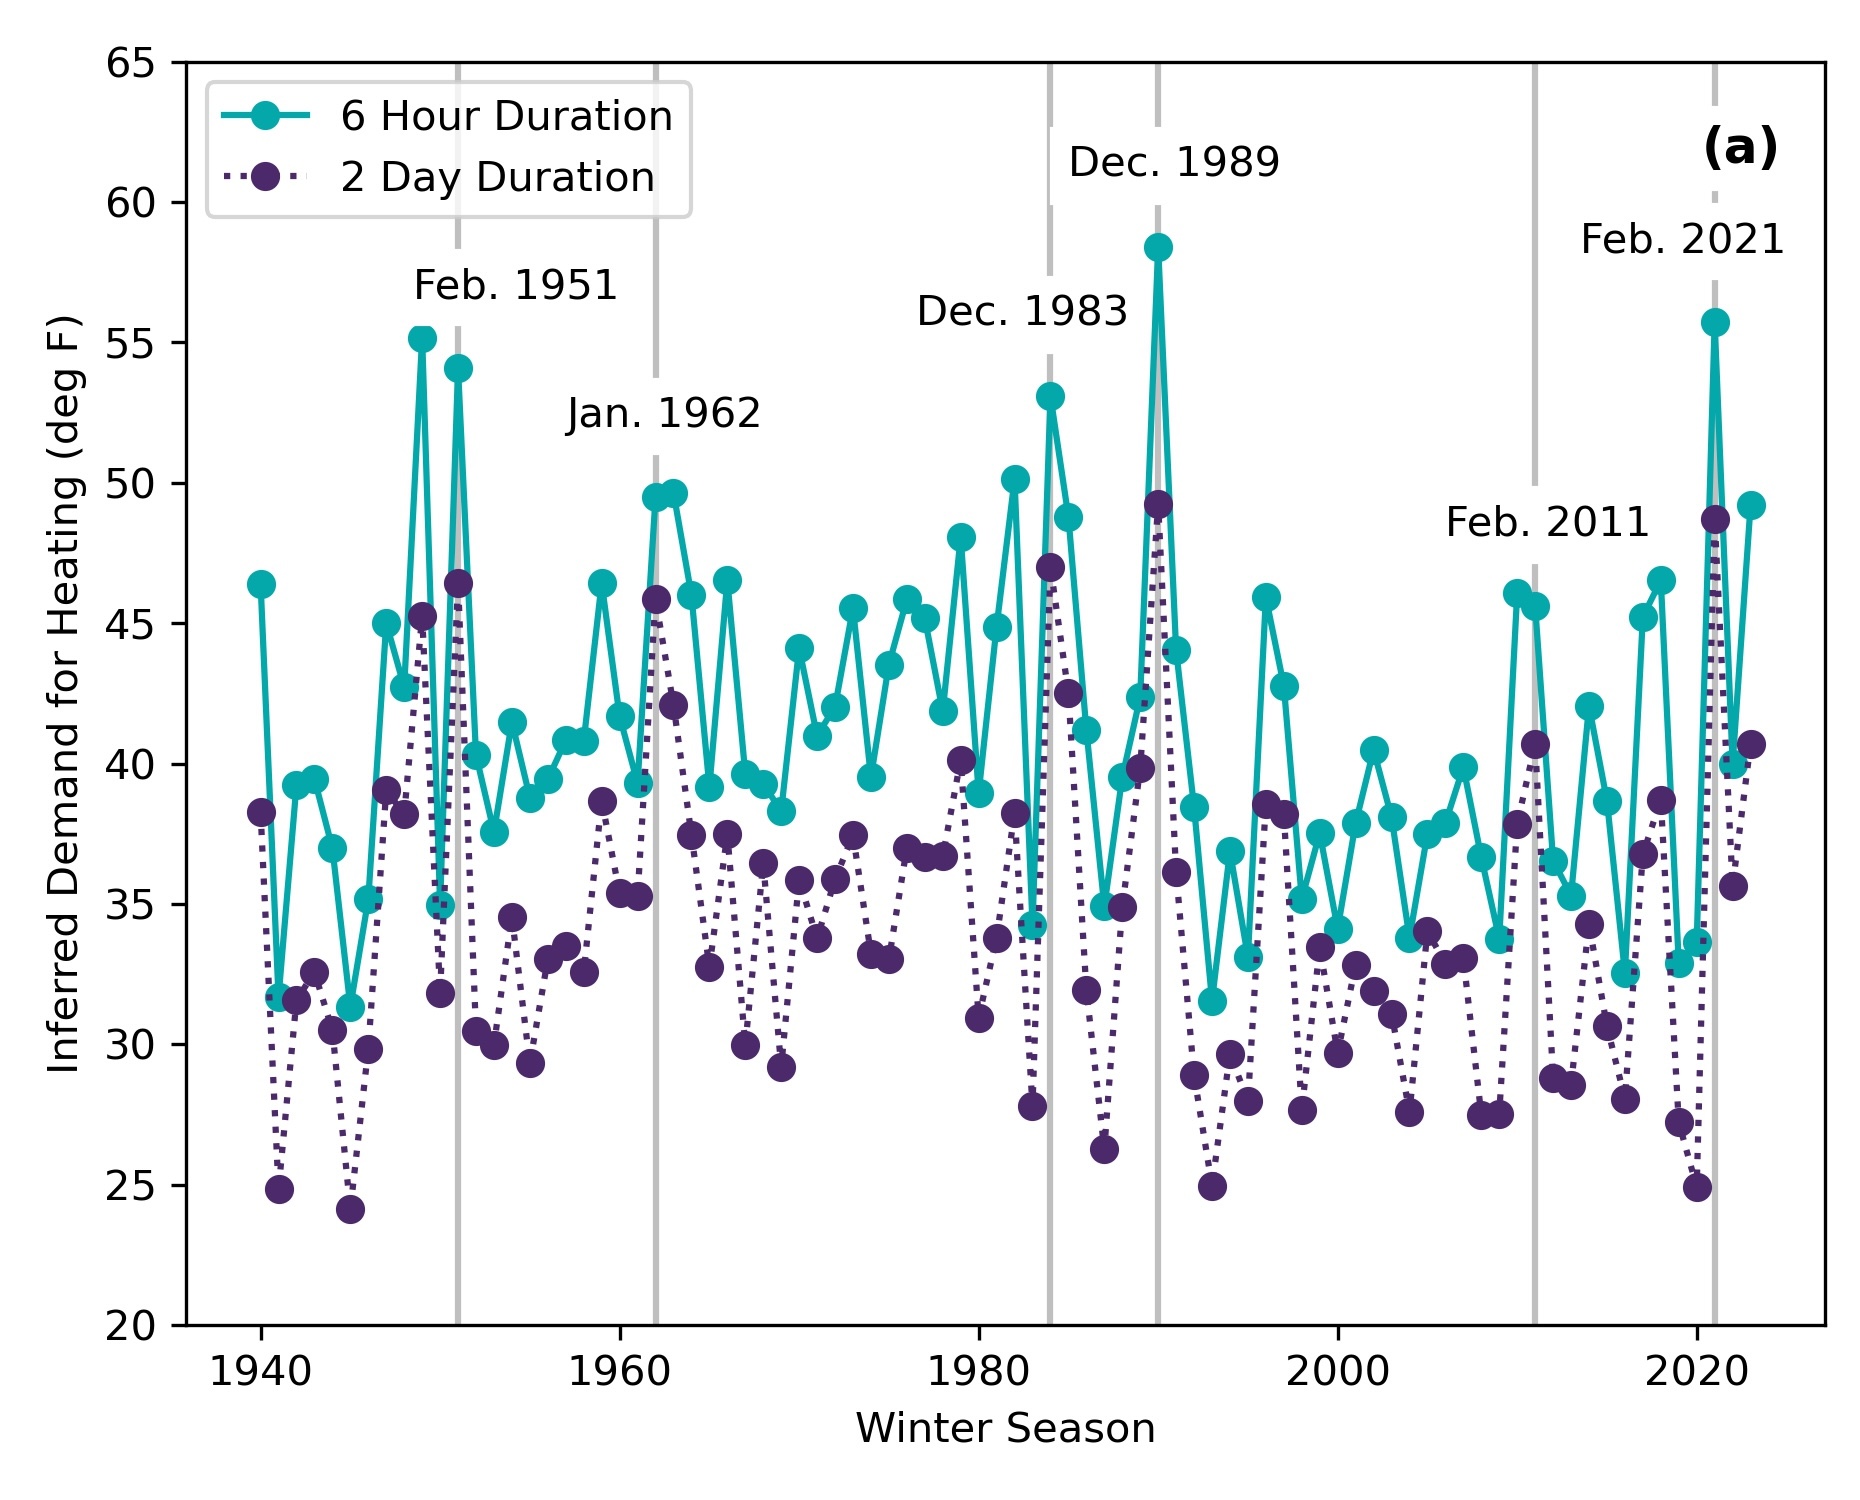
Inferred demand for heating

  1. For each grid cell and each hour, calculate the difference between observed temperature and “comfortable” temperature
  2. Take average, weighting by population

What is the return period of temperatures observed during the 2021 Texas freeze as a function of the defined duration of the event?

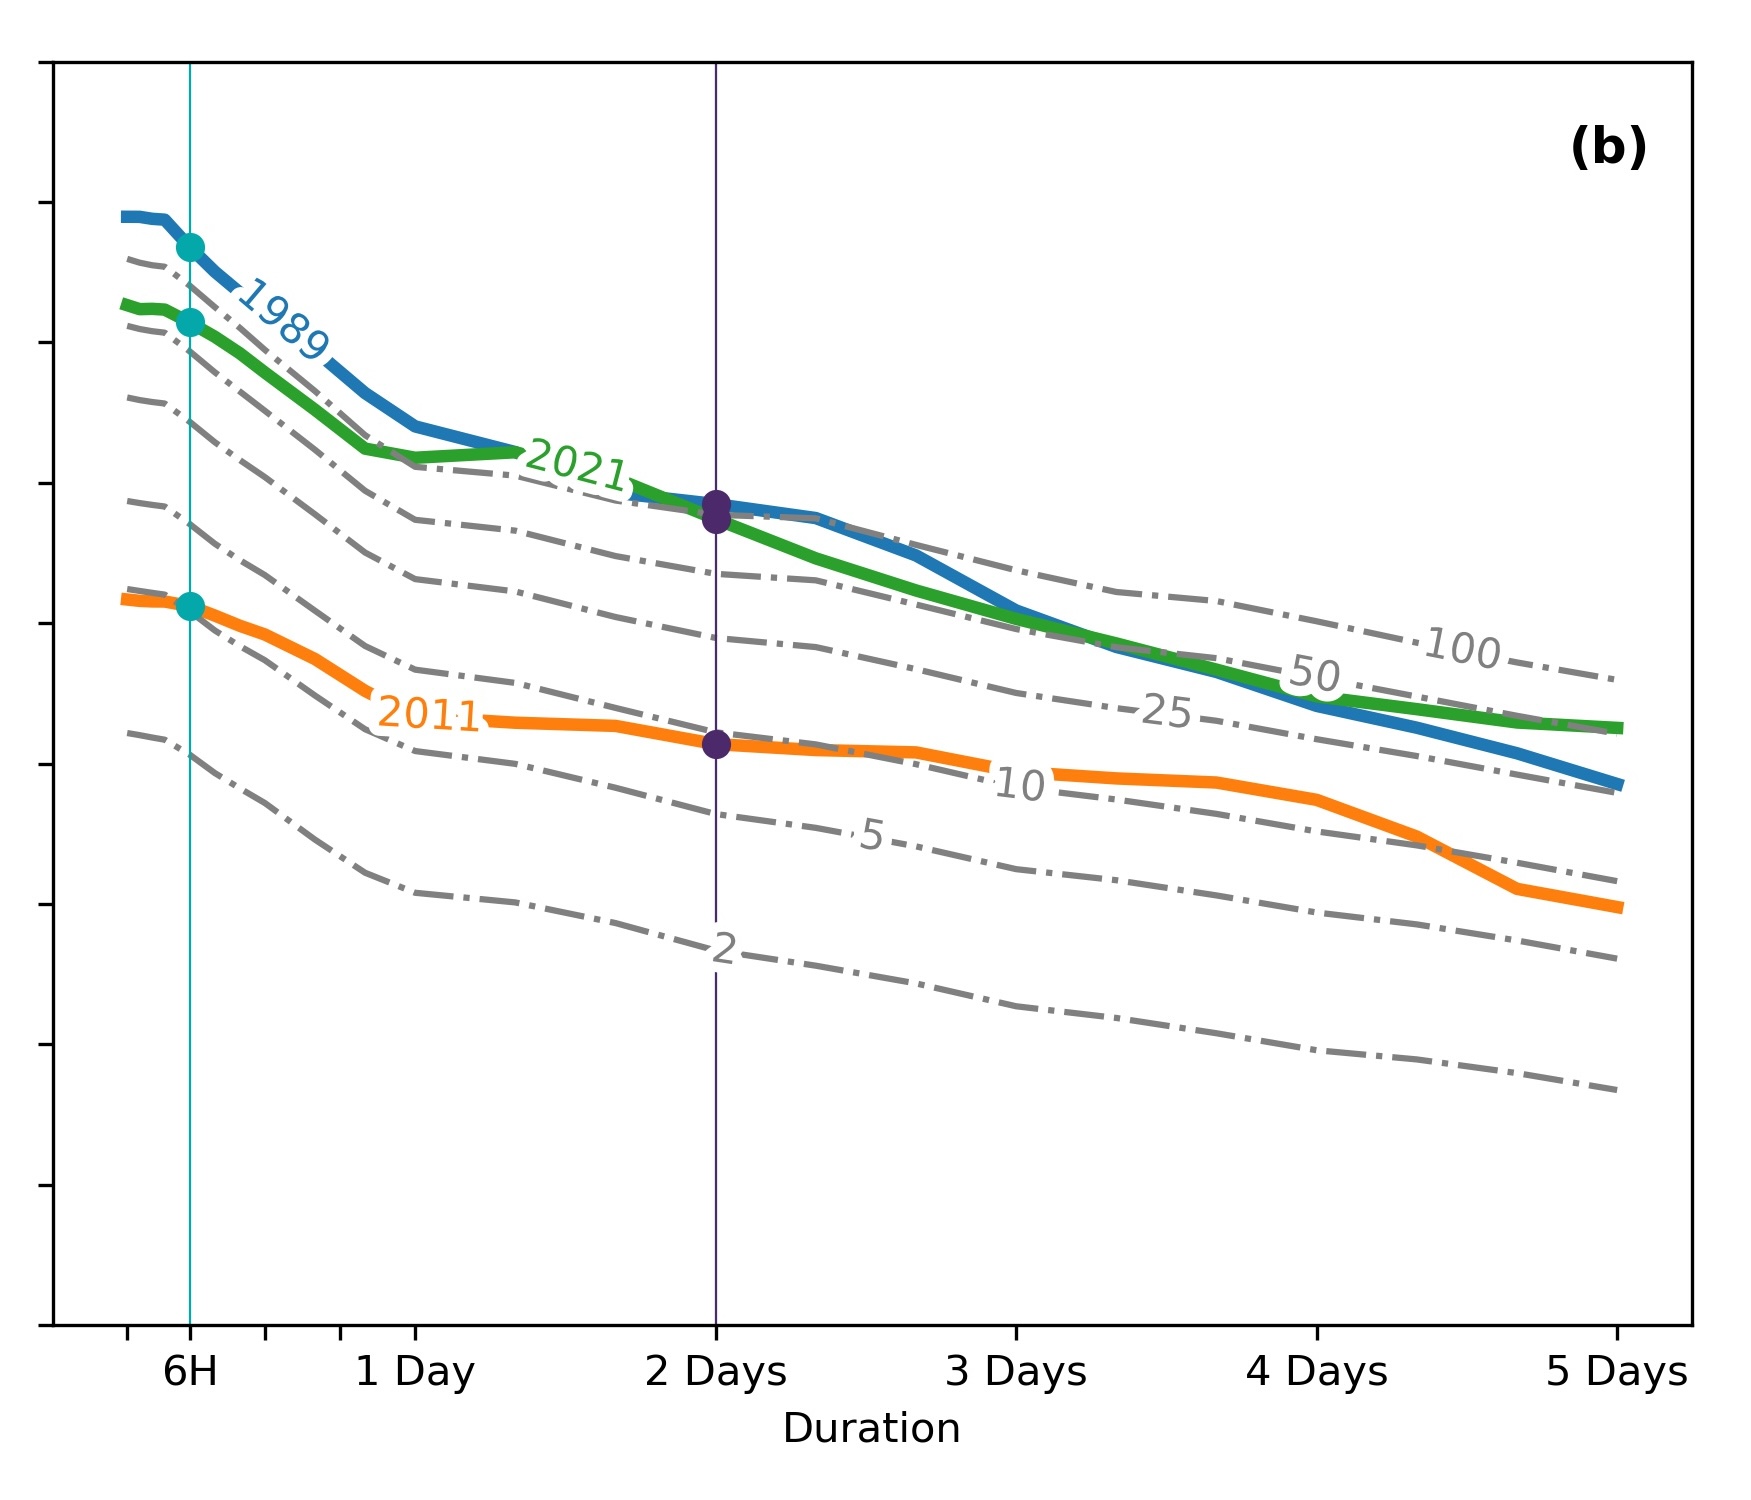
Figure 7: Fig 2b of Doss-Gollin et al. (2021)

Some pitfalls

  1. The past (1950-2022) may not be a good guide to the future
  2. Temperature is not the only factor that influences demand for heating

Lee & Dessler (2022) addresses (1) by using a large climate ensemble to explore the distribution of extreme temperatures and (2) by modeling demand as a function of temperature.

CESM-LE

  1. CESM (Community Earth System Model) is one of many widely-used models of global climate
    • “GCM” or “ESM”
  2. Uses historical forcing with no data assimilation
    • Thus, “April 11, 1982” in the MODEL will NOT look like “April 11, 1982” in OBSERVATIONS
    • It WILL look like a sample from the distribution of possible weather in mid-Aprils in the 1980s
  3. Large ensemble: characterizing distributions needs large \(N\)

Bias correction

  1. Recall: ESMs don’t assimilate observations, In general, they will be biased in the distribution of some variable(s).
  2. Many methods”
    1. Offset (LD 22)
    2. QQ Mapping
    3. And more complex stuff
  3. Many pitfalls!
Code
d1 = Normal(3, 1.5)
d2 = Normal(2.5, 1.5)
plot(d1, label="True", xlabel=L"$x$", ylabel=L"$p(x)$", legend=:topleft, title="Different Mean, Same Variance")
plot!(d2, label="Model")
Code
d1 = Normal(3, 1.5)
d2 = Normal(2.5, 1.8)
plot(d1, label="True", xlabel=L"$x$", ylabel=L"$p(x)$", legend=:topleft, title="Different Mean, Different Variance")
plot!(d2, label="Model")
Code
d1 = LogNormal(1, 0.5)
d2 = Normal(mean(d1), std(d1))
plot(d1, label="True", xlabel=L"$x$", ylabel=L"$p(x)$", legend=:topleft, title="Same Mean and Variance, Different Distribution")
plot!(d2, label="Model")

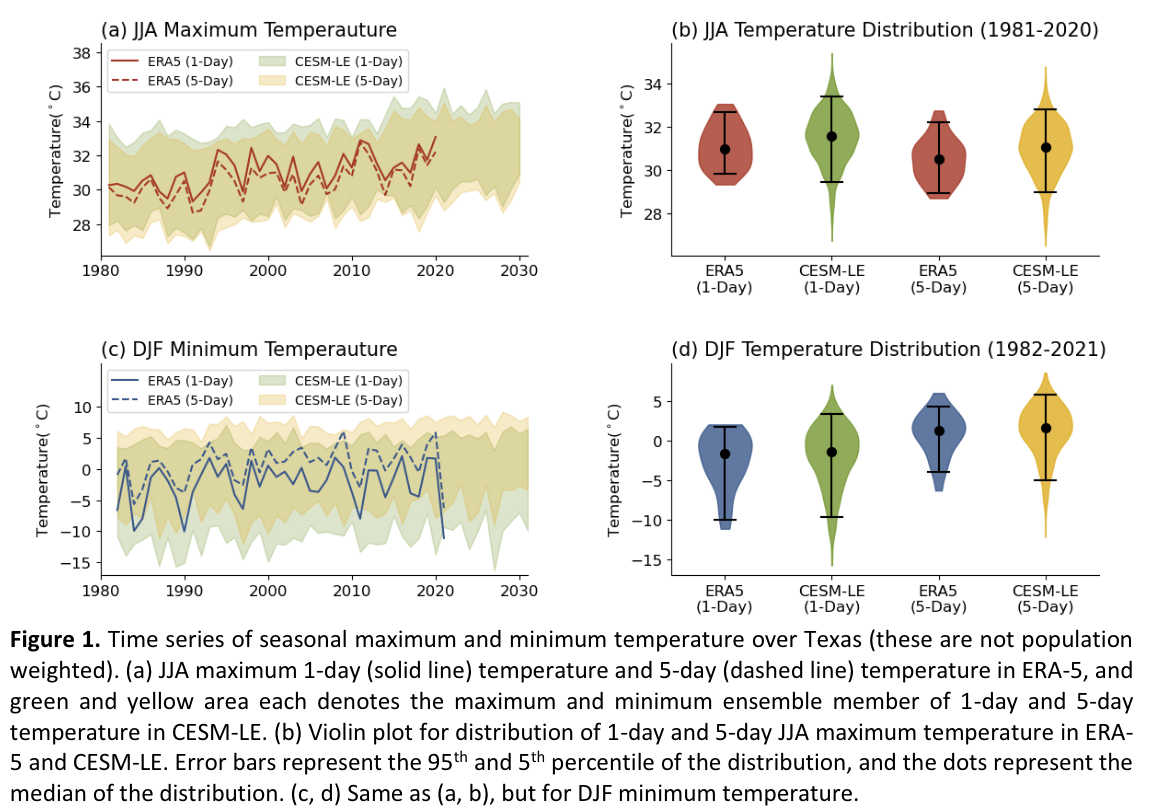
CESM-LE Temperatures

  1. Hottest (coldest) extremes in CESM-LE are hotter (colder) than observations
  2. Summer \(T\) maxima smoother than winter minima
  3. 1-day more extreme than 5-day (duh?)
  4. Temps observed in Feb 2021 not that unusual given CESM-LE simulations
Figure 8: Lee & Dessler (2022)

demand \(|\) temperature

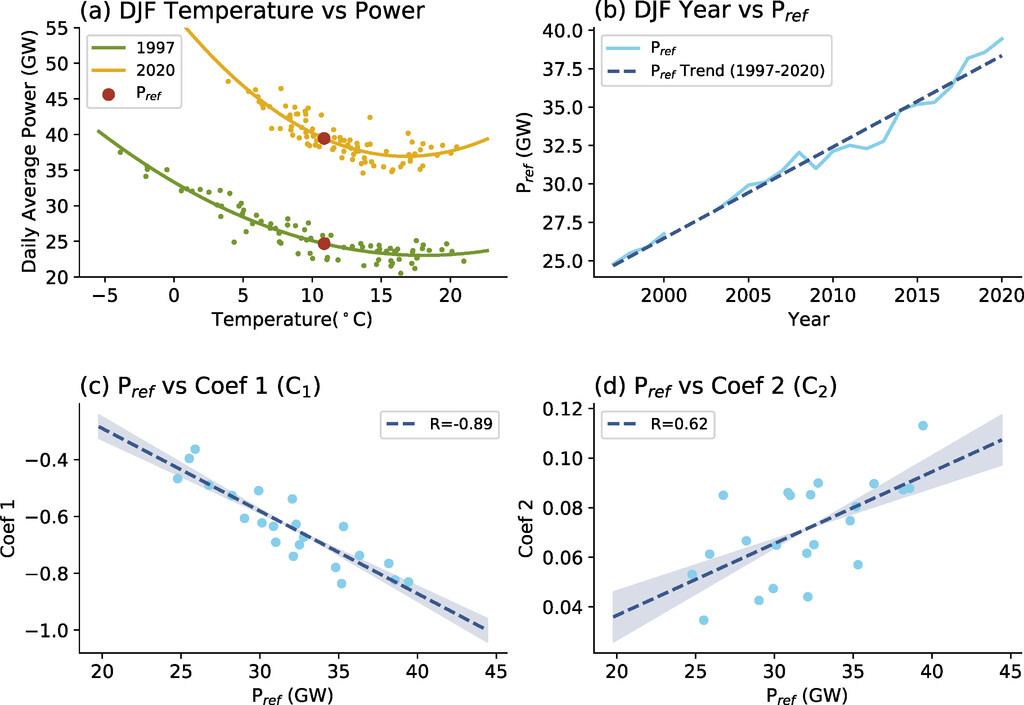
Figure 9: Lee & Dessler (2022)

CESM-LE: PDF of demand

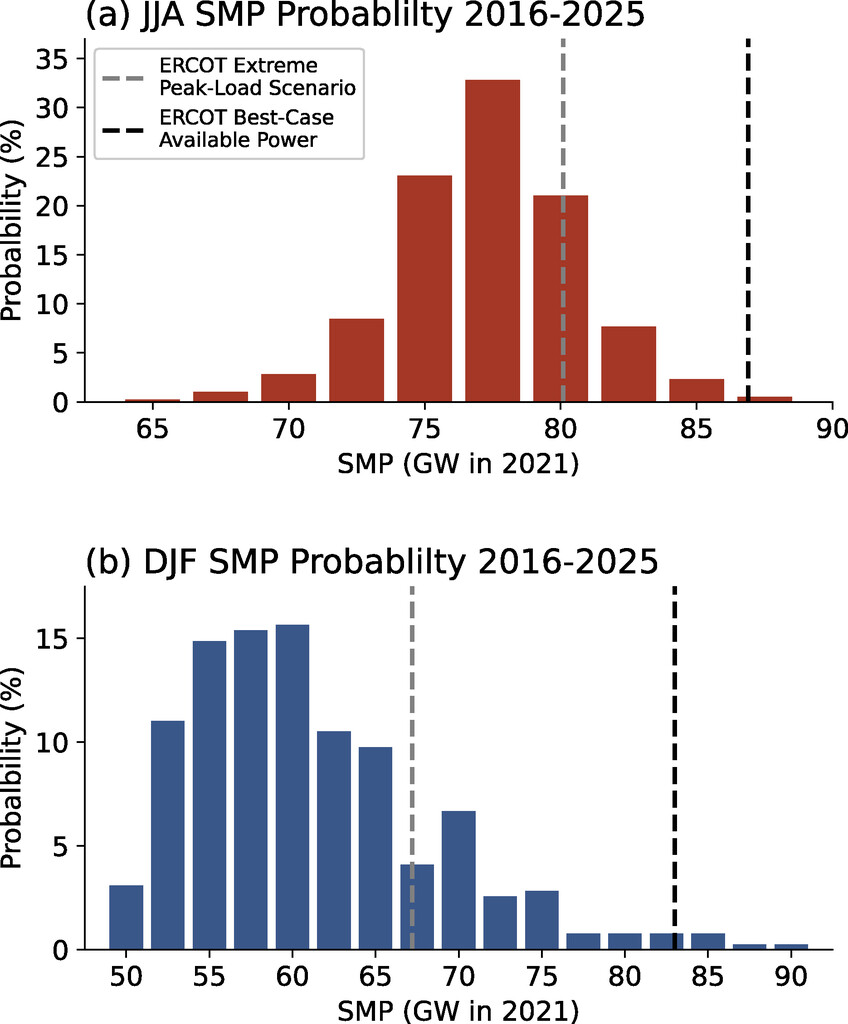
Figure 10: Lee & Dessler (2022)

Trends in total heating and cooling

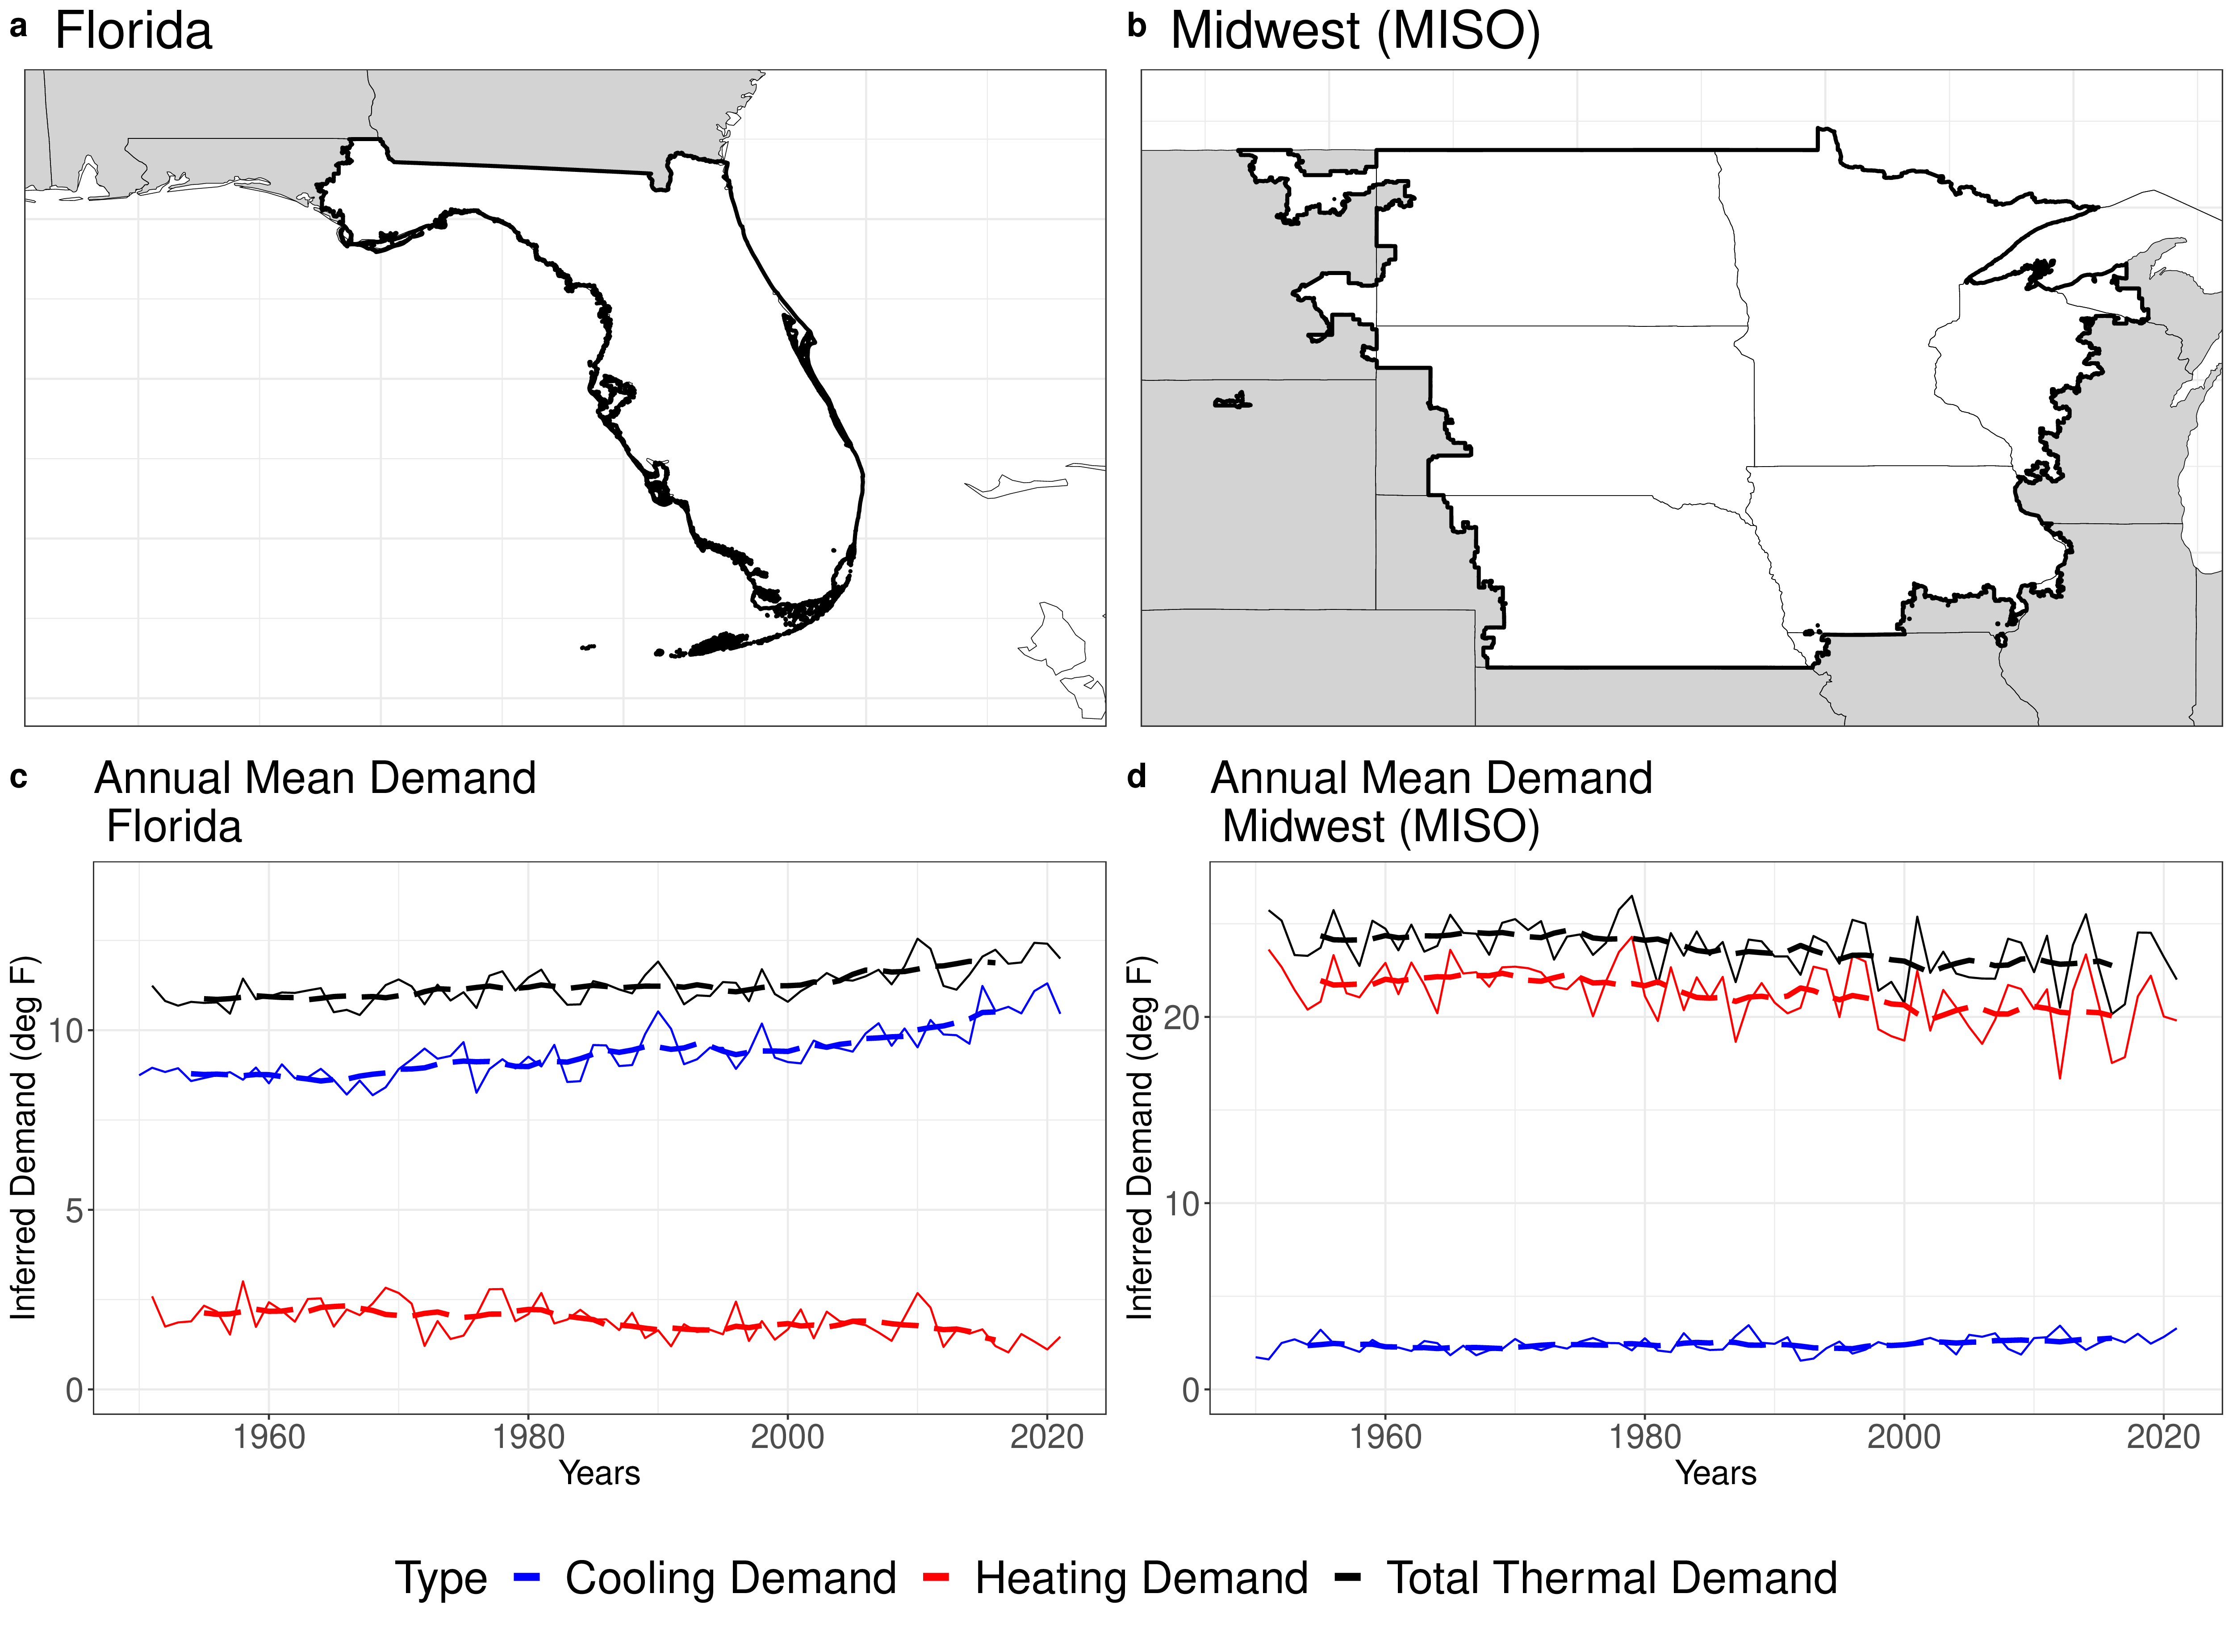
Figure 11: Amonkar et al. (2023)

Trends in peak heating and cooling

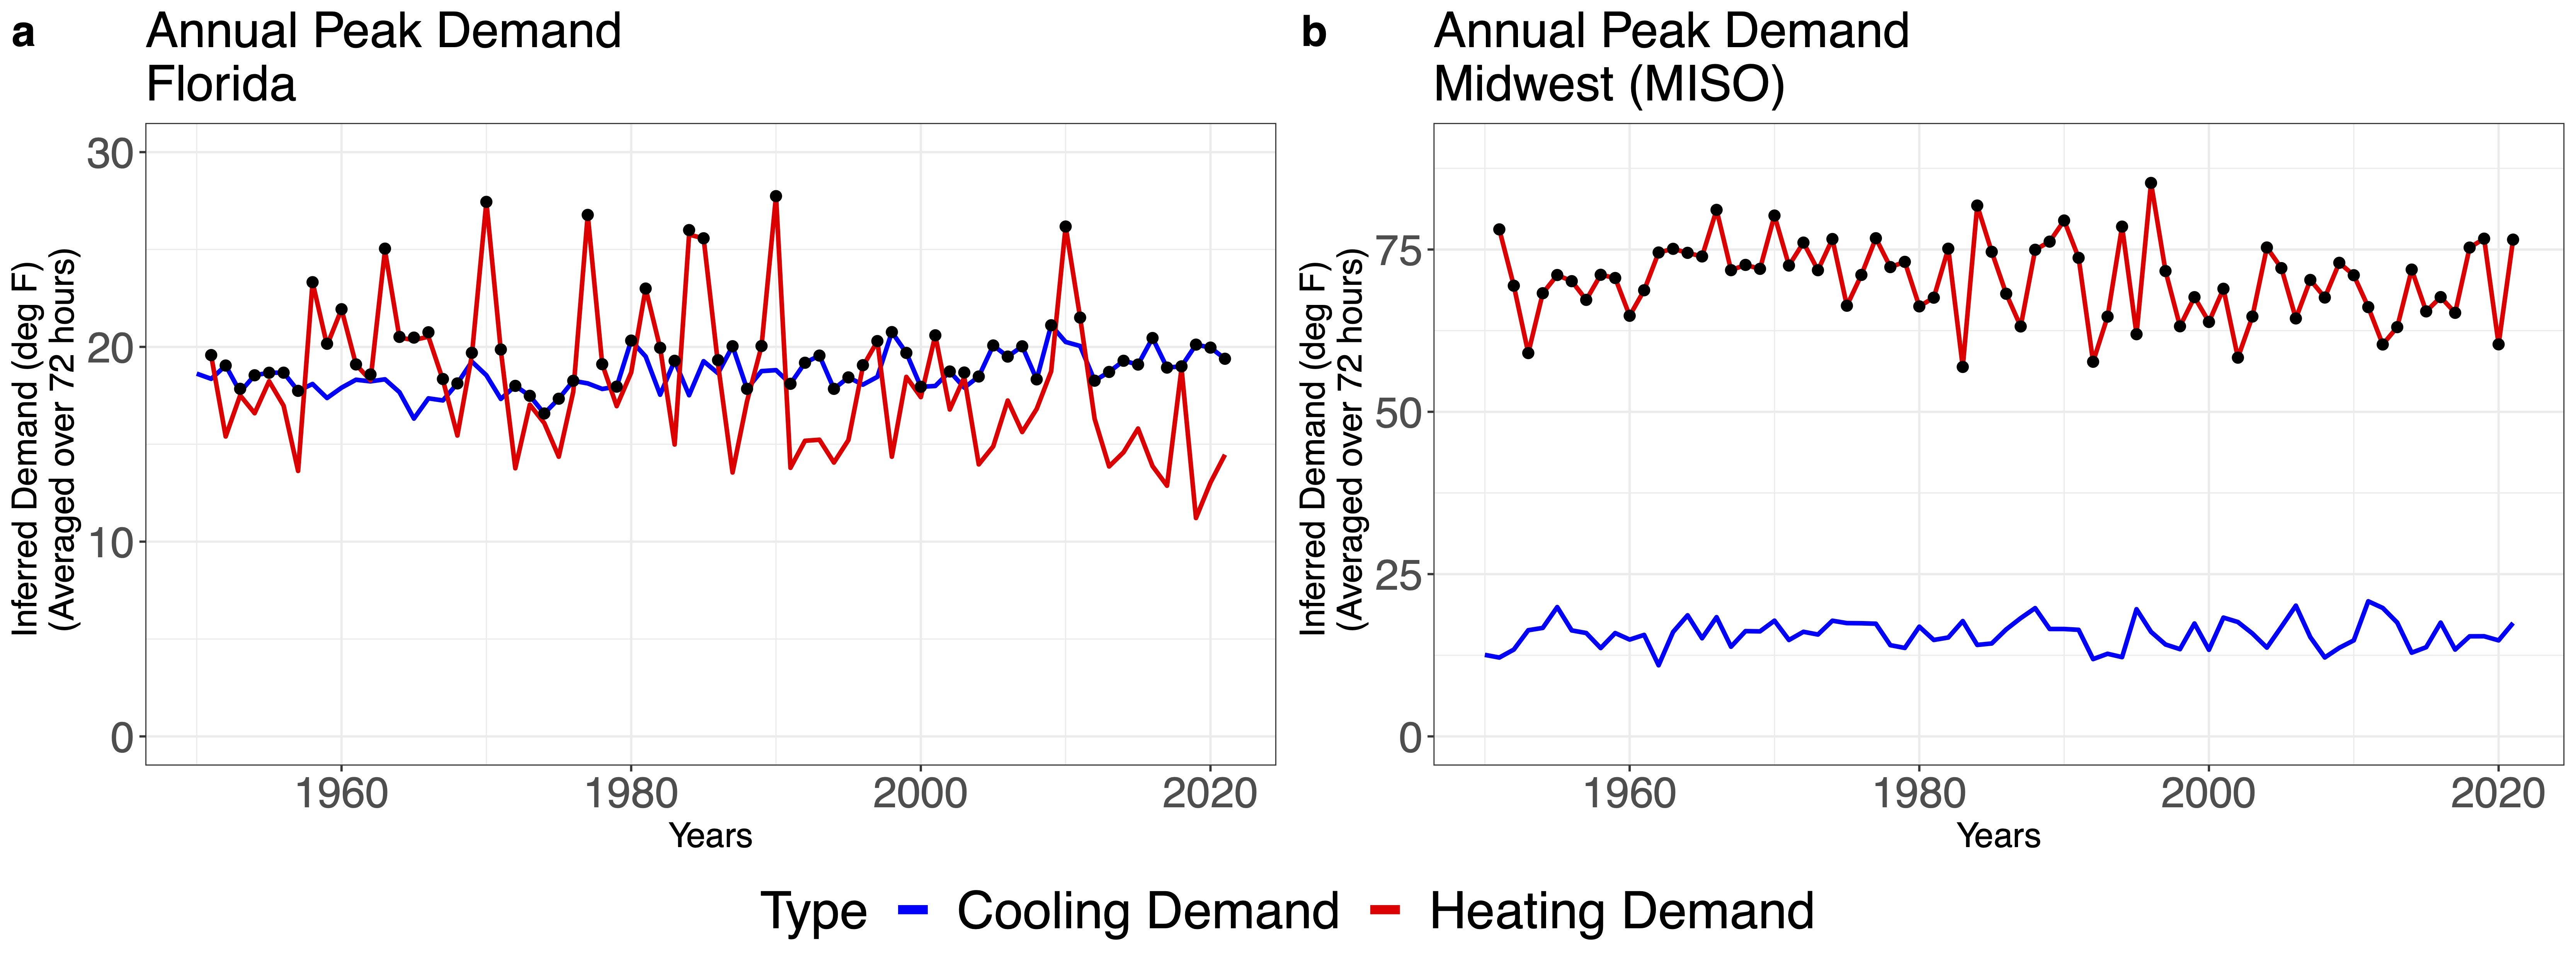
Figure 12: Amonkar et al. (2023)

Electricity supply

Today

  1. 2021 Texas Freeze

  2. Demand for heating

  3. Electricity supply

  4. Wrapup

Key points

Busby et al. (2021):

  1. Gas production dropped ~50%
  2. Outages: 30GW of electricity
  3. Inadequate winterization of electricity and gas systems
  4. Financial repercussions
  5. Primary culprit for outages was problems in electricity production from natural gas

All major fuel sources underperformed

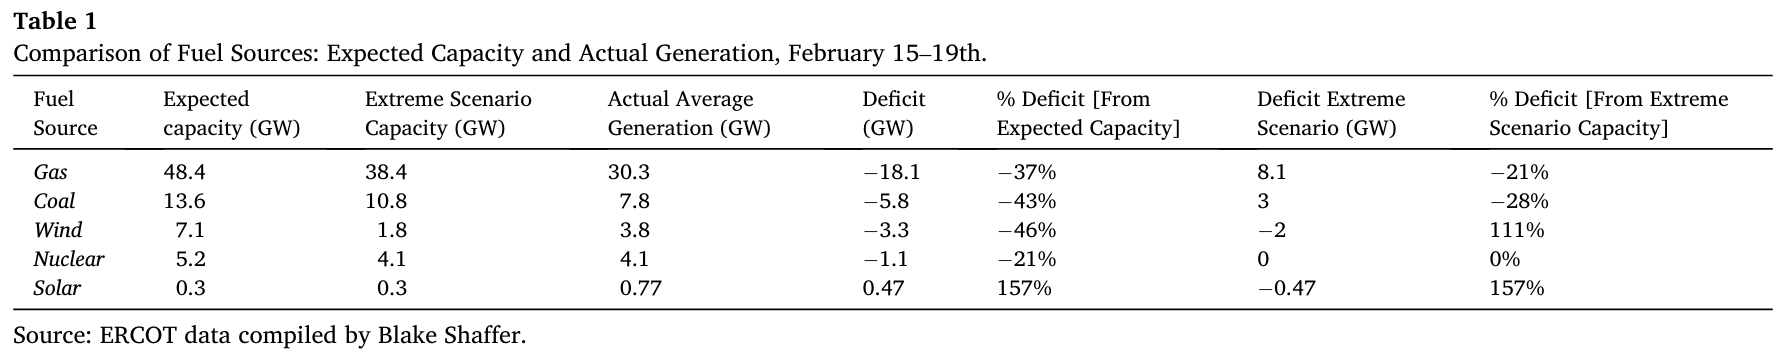
Figure 13: Busby et al. (2021)

Who lost power?

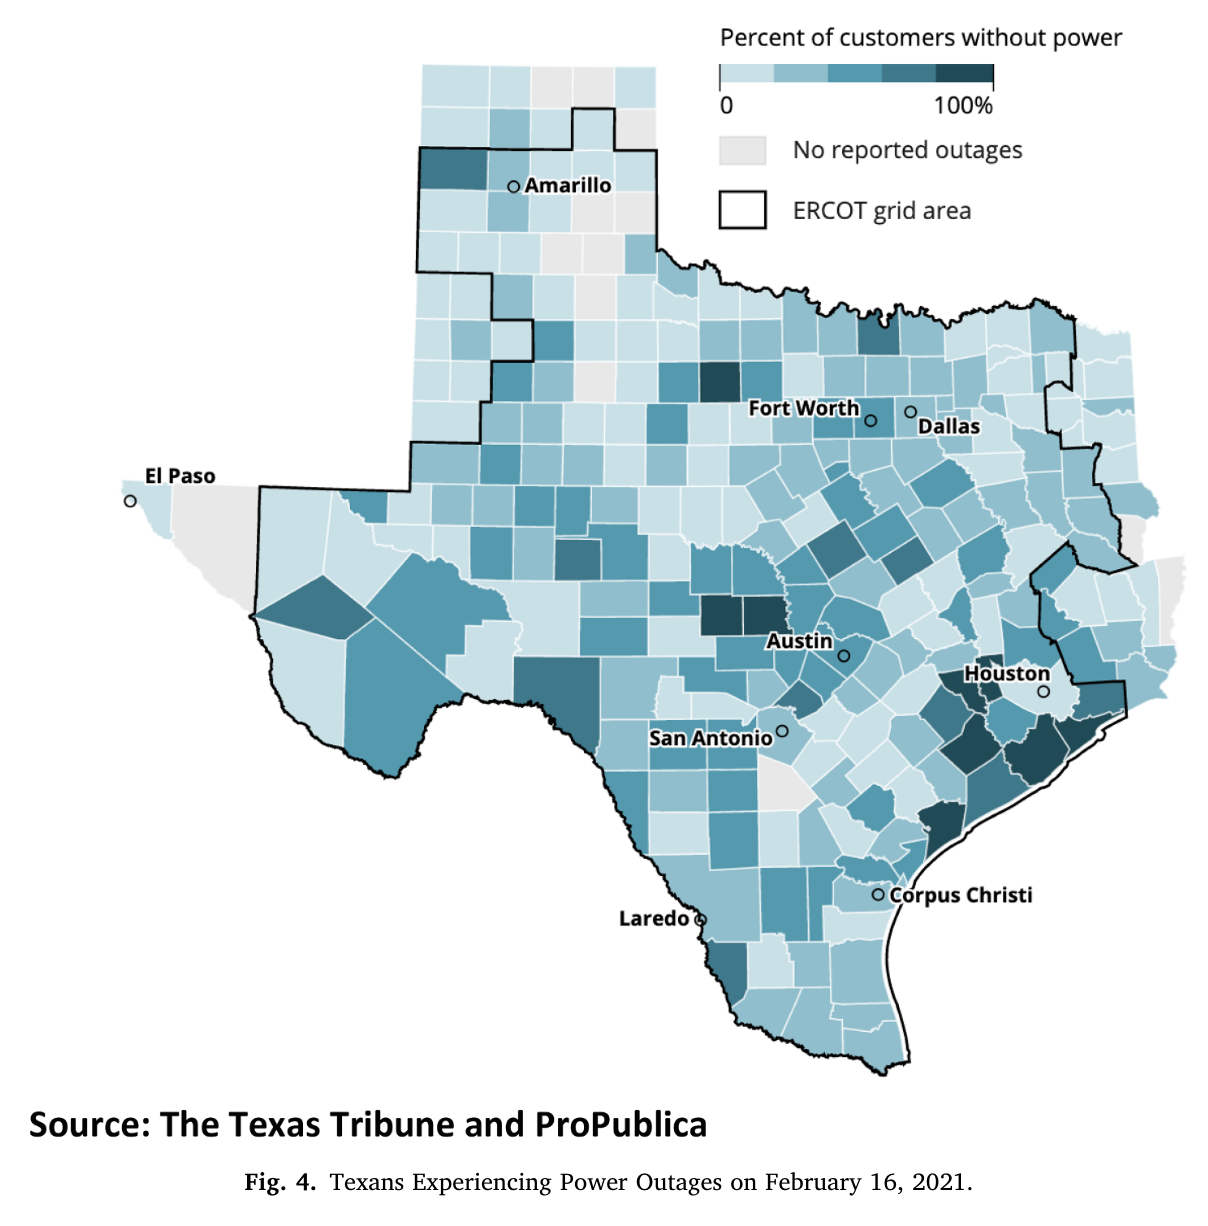
Figure 14: Busby et al. (2021)

Cascading risks (view thread!)

So what?

  1. If we wanted to model the natural gas ➡️ electricity supply chain, we would need to know (at minimum!):
    1. Locations of all wells, separators, gathering lines, compressors, power stations
    2. Weatherization / vulnerability to cold of all
    3. This is very hard!
  2. Climate risk to complex systems is hard!
  3. Hence, attempts at standardized design rules / standards

Wrapup

Today

  1. 2021 Texas Freeze

  2. Demand for heating

  3. Electricity supply

  4. Wrapup

Policy recommendations

Busby et al. (2021), Doss-Gollin et al. (2021):

  1. Regulation and price incentives
  2. Plan for winter peaks, not summer ones!
  3. Weatherization
  4. Demand response
  5. Regional transmission

Grid resilience in an electrified, renewable-powered world is possible but non-trivial to ensure

Summary

2021 Texas Cold Snap

  1. Cold temperatures: demand for heating 📈
  2. Cold temperatures: supply of electricity 📉
    1. Complex supply chain!
  3. Joint effects: cascading failures

How to analyze?

  1. Observations/reanalysis: not very many extremes
  2. ESMs: bigger sample size, but biased
    • Many pitfalls to bias correction
  3. Fragility of individual components ➡️ interdependence ➡️ system performance

Climate risks to electricity systems

See Doss-Gollin et al. (2023) for a review:

  1. Outages from severe weather
  2. At long time scales, technological and demopgrahic drivers of demand dominate
  3. At shorter time scales, interannual variability critically important

Exam Friday

  1. Wednesday: half of class time for review session
  2. To study: review slides and readings (Julia code will not be on the exam)
  3. Focus on key concepts and ideas

References

Amonkar, Y., Doss-Gollin, J., Farnham, D. J., Modi, V., & Lall, U. (2023). Differential effects of climate change on average and peak demand for heating and cooling across the contiguous USA. Communications Earth & Environment, 4(1, 1), 1–9. https://doi.org/10.1038/s43247-023-01048-1
Busby, J. W., Baker, K., Bazilian, M. D., Gilbert, A. Q., Grubert, E., Rai, V., et al. (2021). Cascading risks: Understanding the 2021 winter blackout in Texas. Energy Research & Social Science, 77, 102106. https://doi.org/10.1016/j.erss.2021.102106
Doss-Gollin, J., Farnham, D. J., Lall, U., & Modi, V. (2021). How unprecedented was the February 2021 Texas cold snap? Environmental Research Letters. https://doi.org/10.1088/1748-9326/ac0278
Doss-Gollin, J., Amonkar, Y., Schmeltzer, K., & Cohan, D. (2023). Improving the representation of climate risks in long-term electricity systems planning: A critical review. Current Sustainable/Renewable Energy Reports. https://doi.org/10.1007/s40518-023-00224-3
Lee, J., & Dessler, A. E. (2022). The Impact of Neglecting Climate Change and Variability on ERCOT’s Forecasts of Electricity Demand in Texas. Weather, Climate, and Society, 14(2), 499–505. https://doi.org/10.1175/WCAS-D-21-0140.1
Reed, P. M., Hadjimichael, A., Moss, R. H., Brelsford, C., Burleyson, C. D., Cohen, S., et al. (2022). Multisector Dynamics: Advancing the Science of Complex Adaptive Human-Earth Systems. Earth’s Future, 10(3), e2021EF002621. https://doi.org/10.1029/2021EF002621