Robustness
Lecture
Mon., Mar. 18
Notation
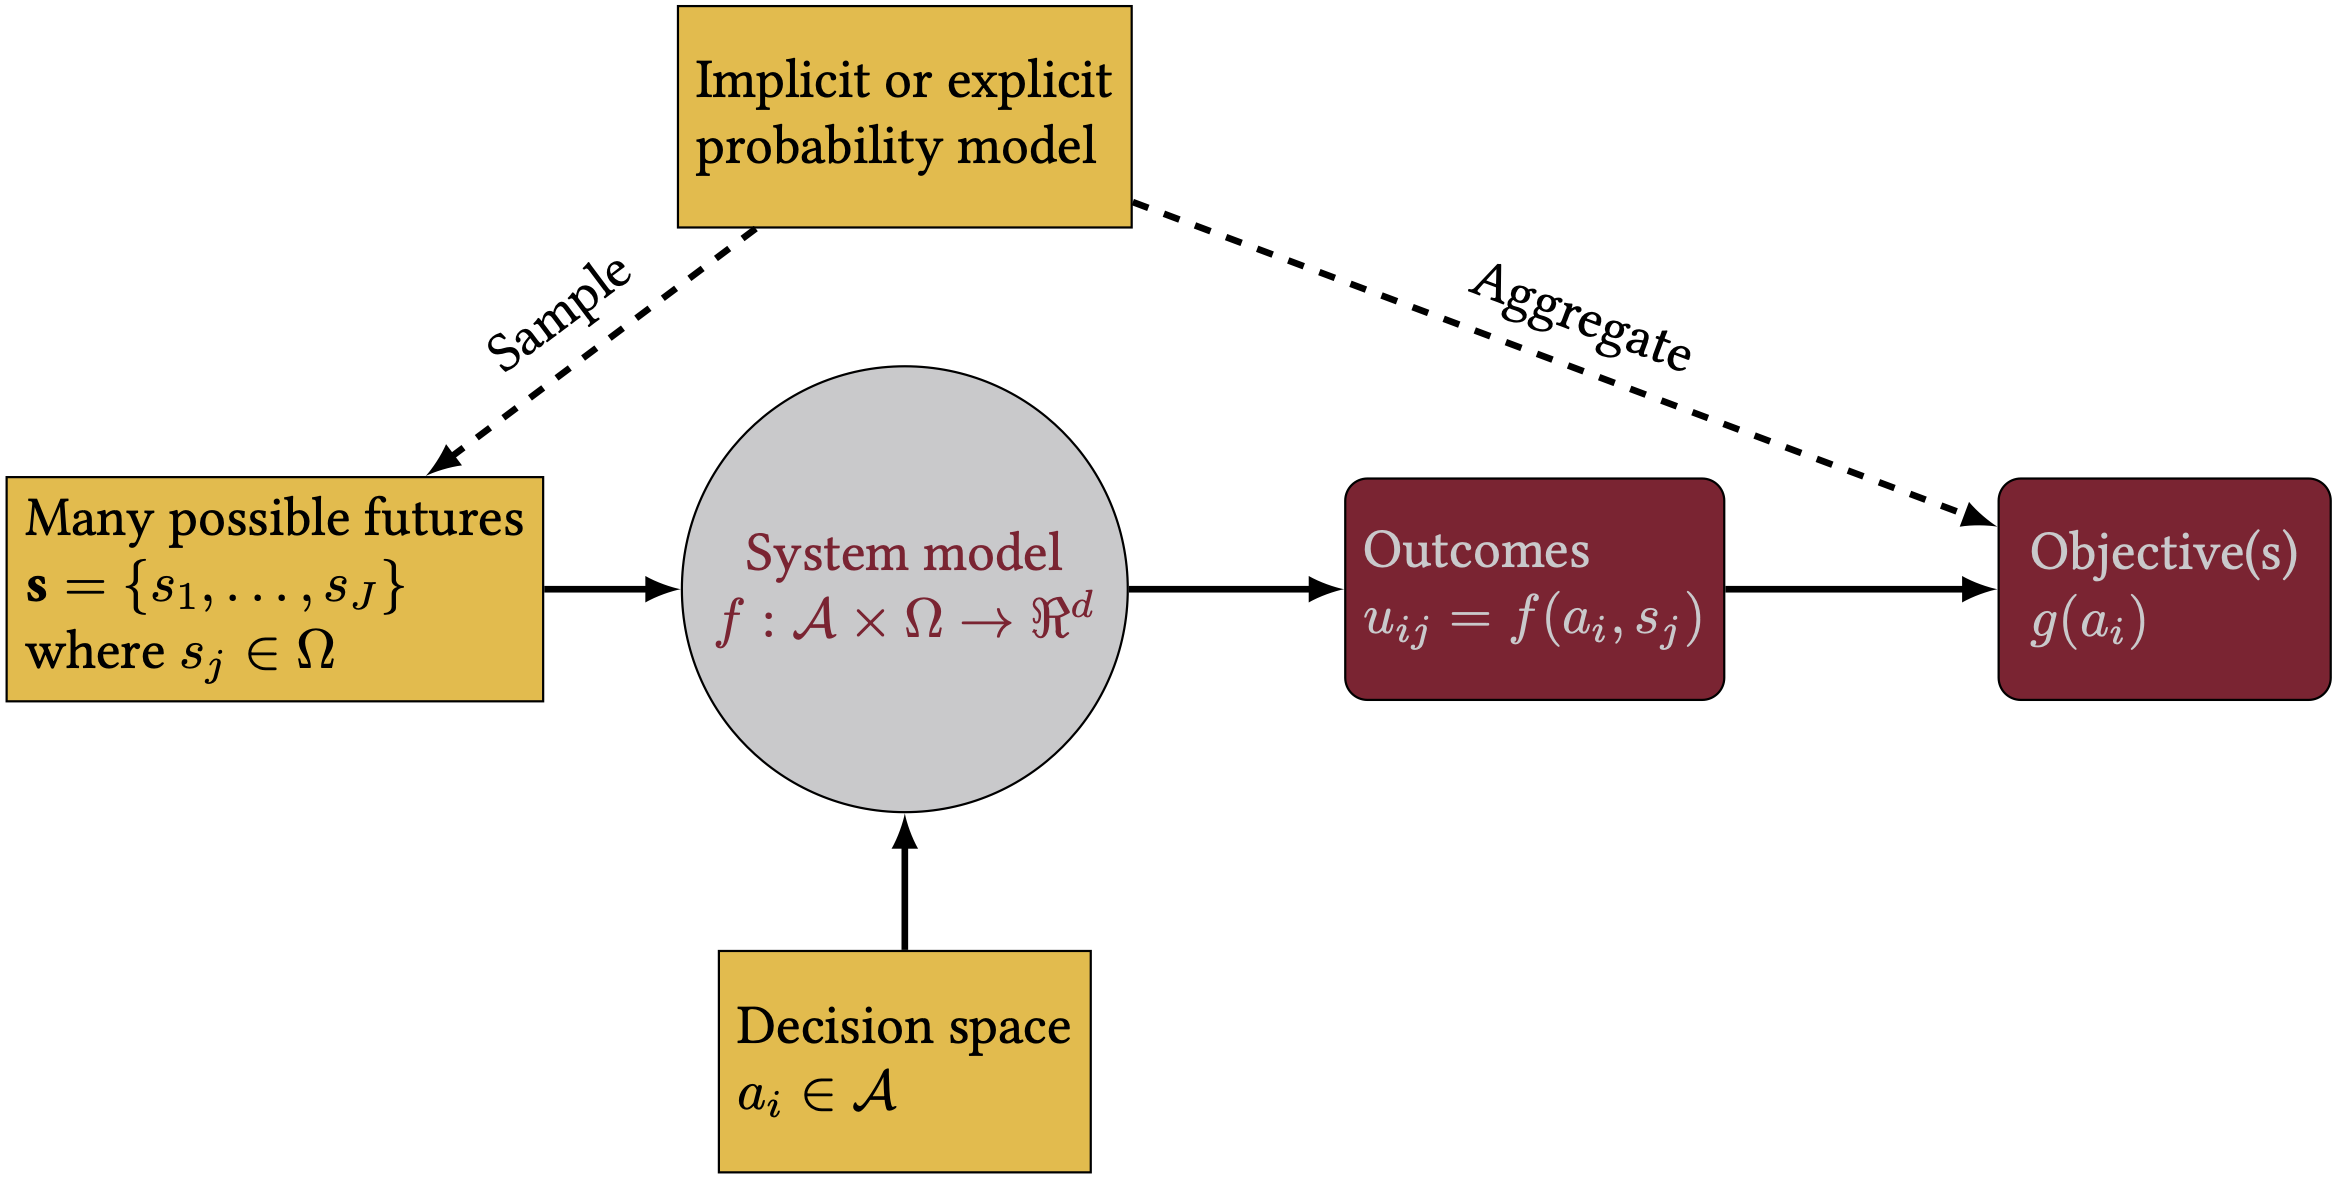
The problem
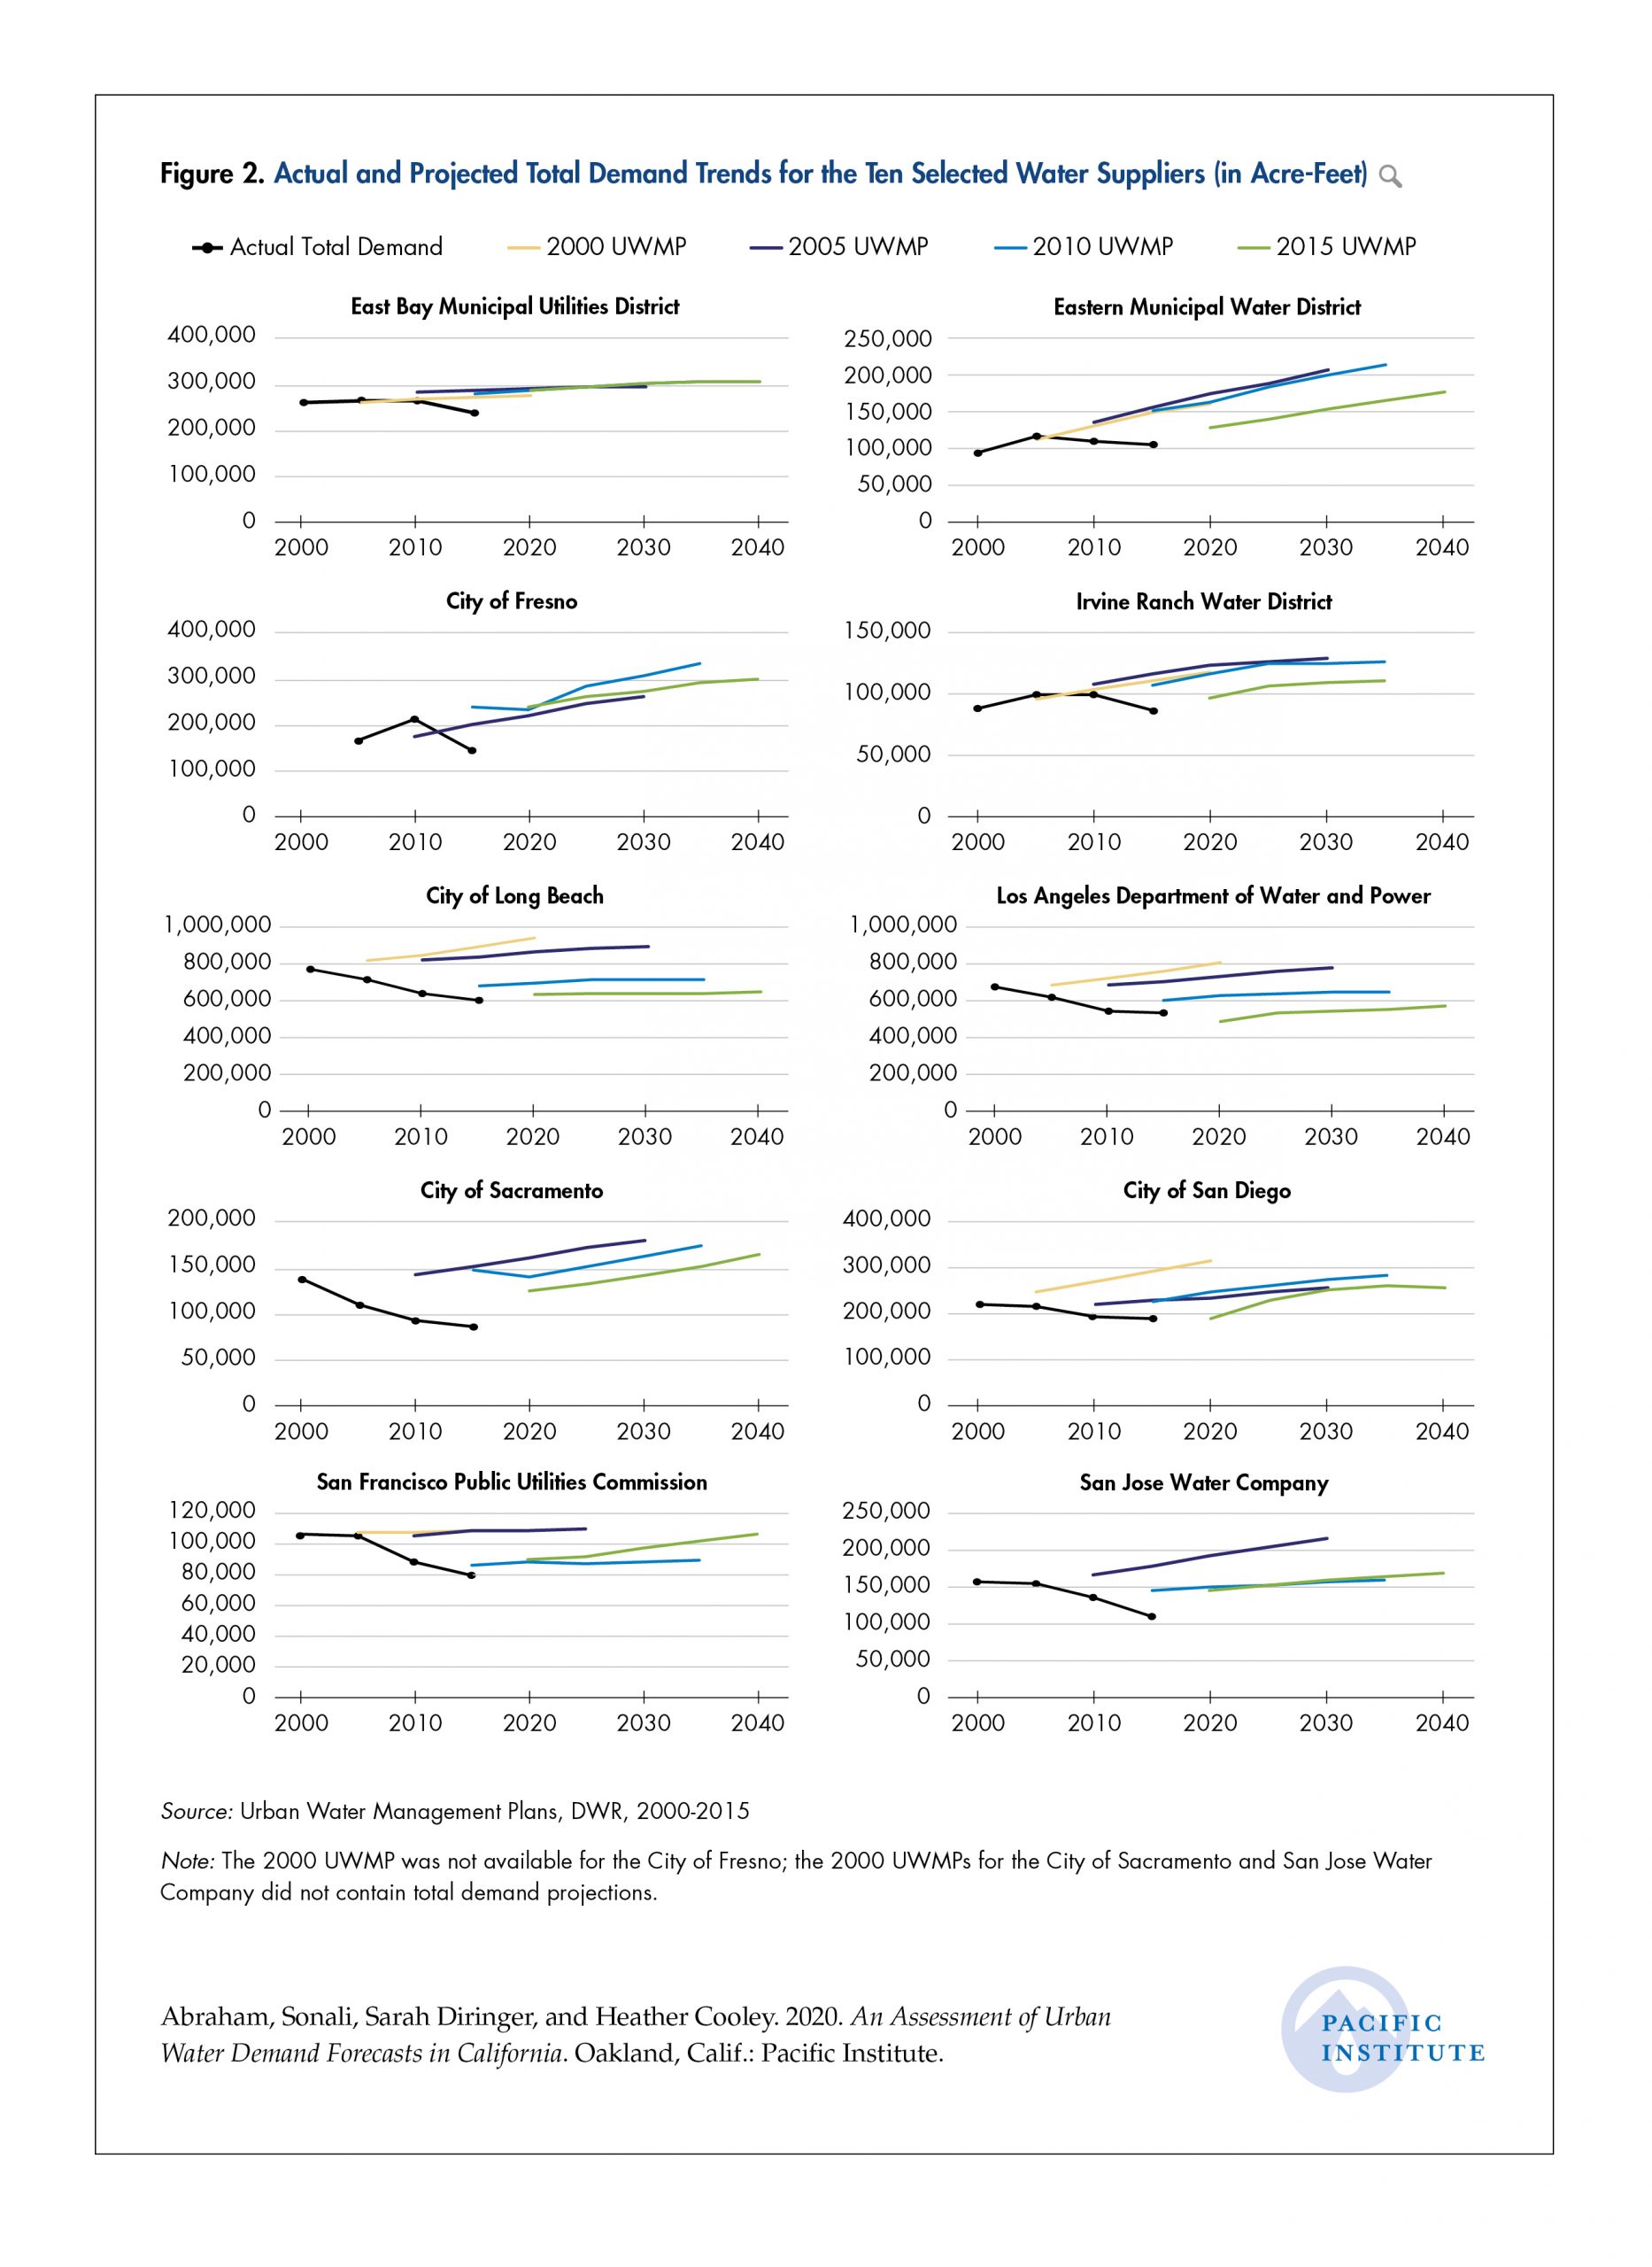
Abraham et al. (2020) show that water utilities systematically over-estimate future demand. Using a single, certain, forecast of future water demand might motivate over-building infrastructure.
Robustness
We want to make choices / design infrastructure that are robust to errors in demand forecasts.
Taxonomy

Herman et al. (2015)
Combinations of uncertainties
In practice, we often have a combination of parametric uncertainties and “model structure” uncertainties (Doss-Gollin & Keller, 2023). And not all SOWs are equally likely!
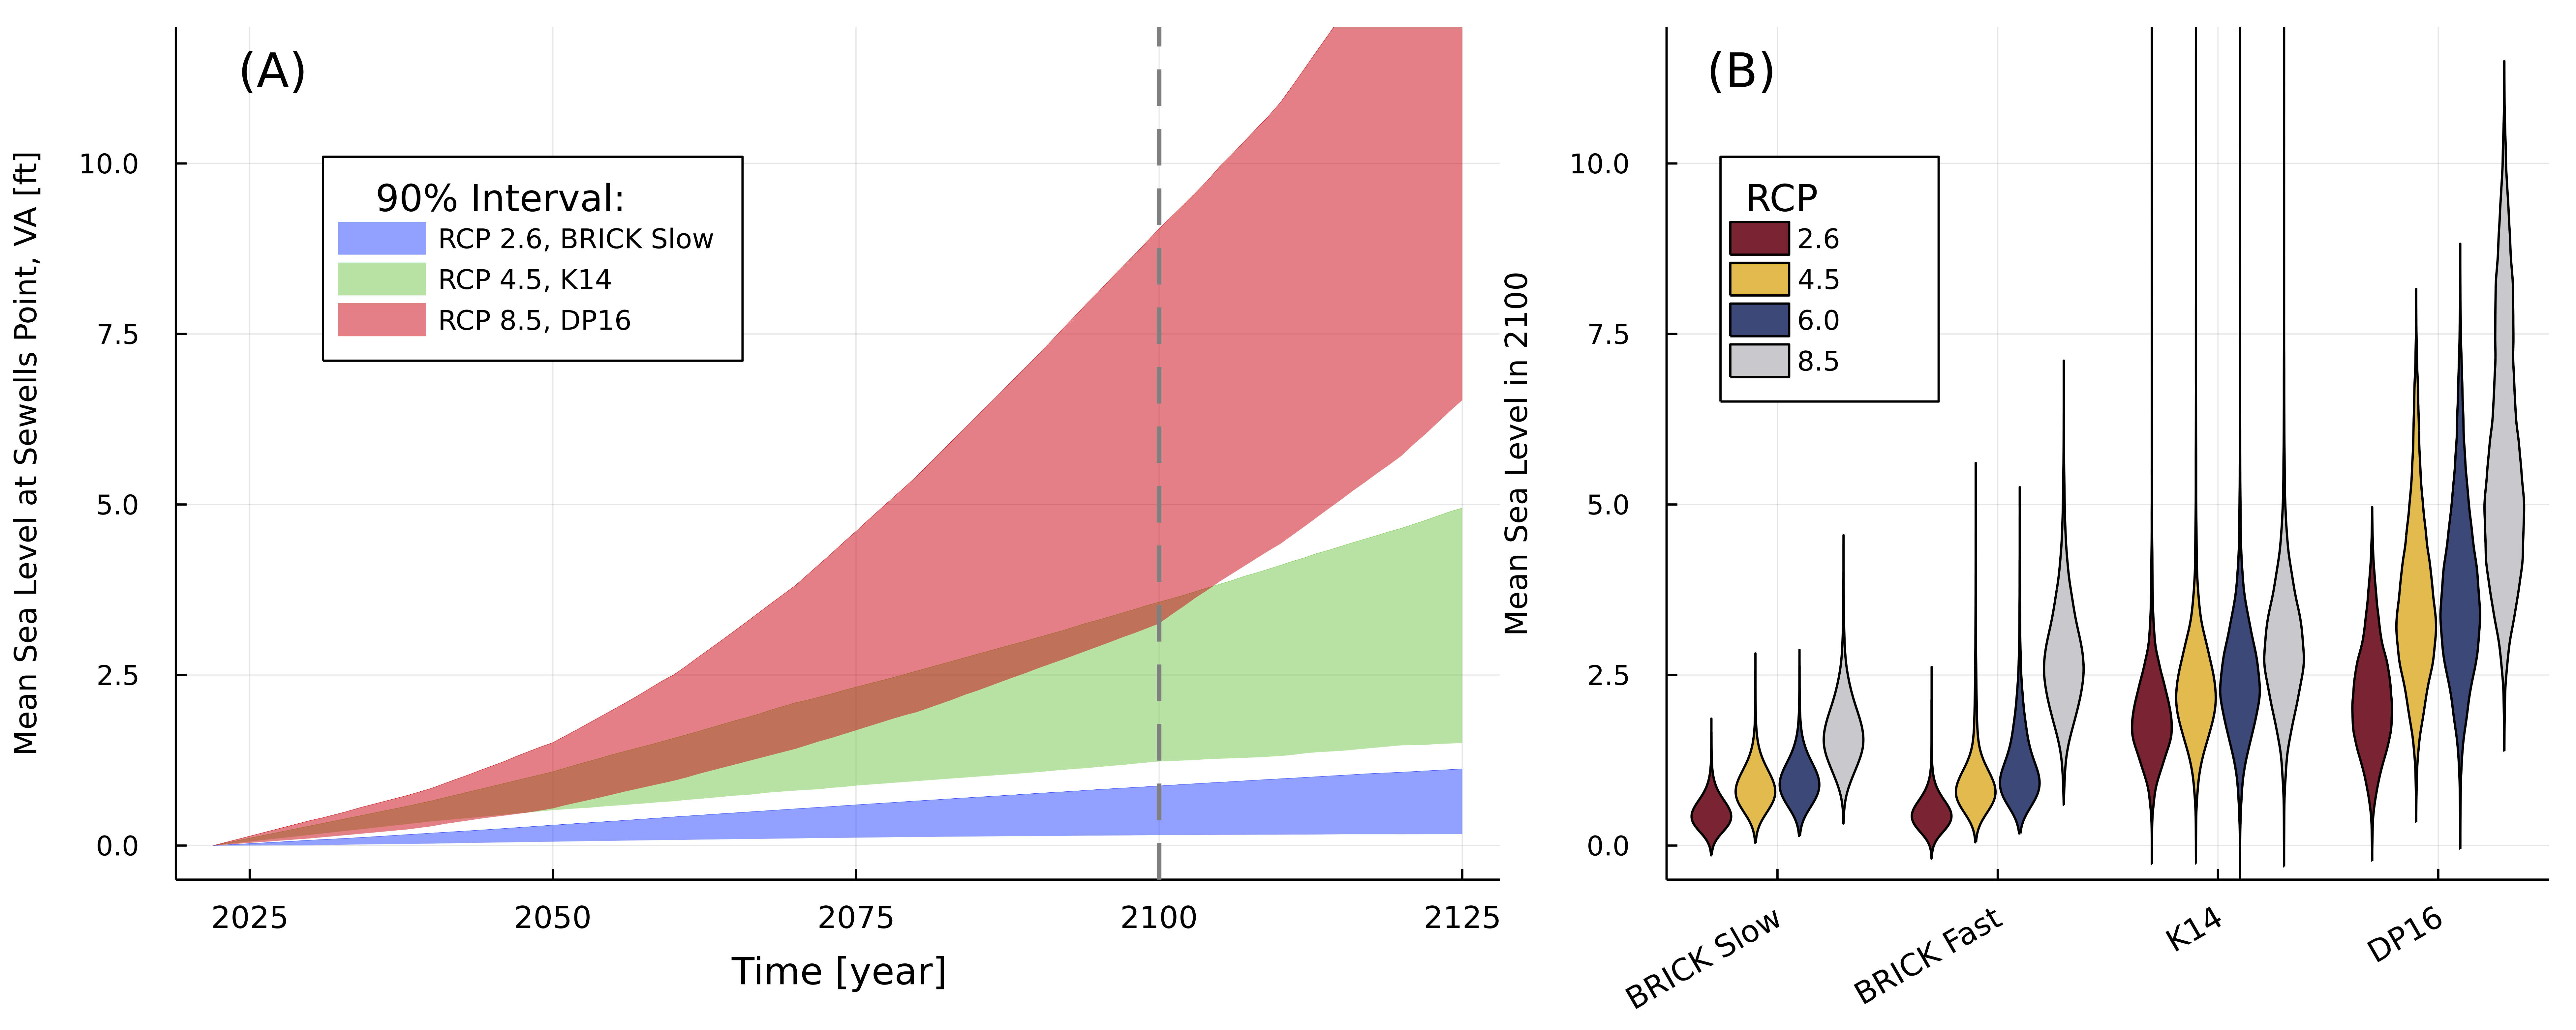

Climate scenario uncertainties are “deep” (more next week!), but it would be a mistake to say we don’t know anything and all futures are equally likely (Hausfather & Peters, 2020)

Alternative perspective
- Using “prior beliefs” assign likelihoods to different SOWs
- Use quantitative toolkit (optimization, sensitivity analysis, etc.)
- Vary prior belefs: a solution that is robust to different probability distributions rather than to different parameter values.