Climate Science and Scenarios
Lecture
Monday, January 26, 2026
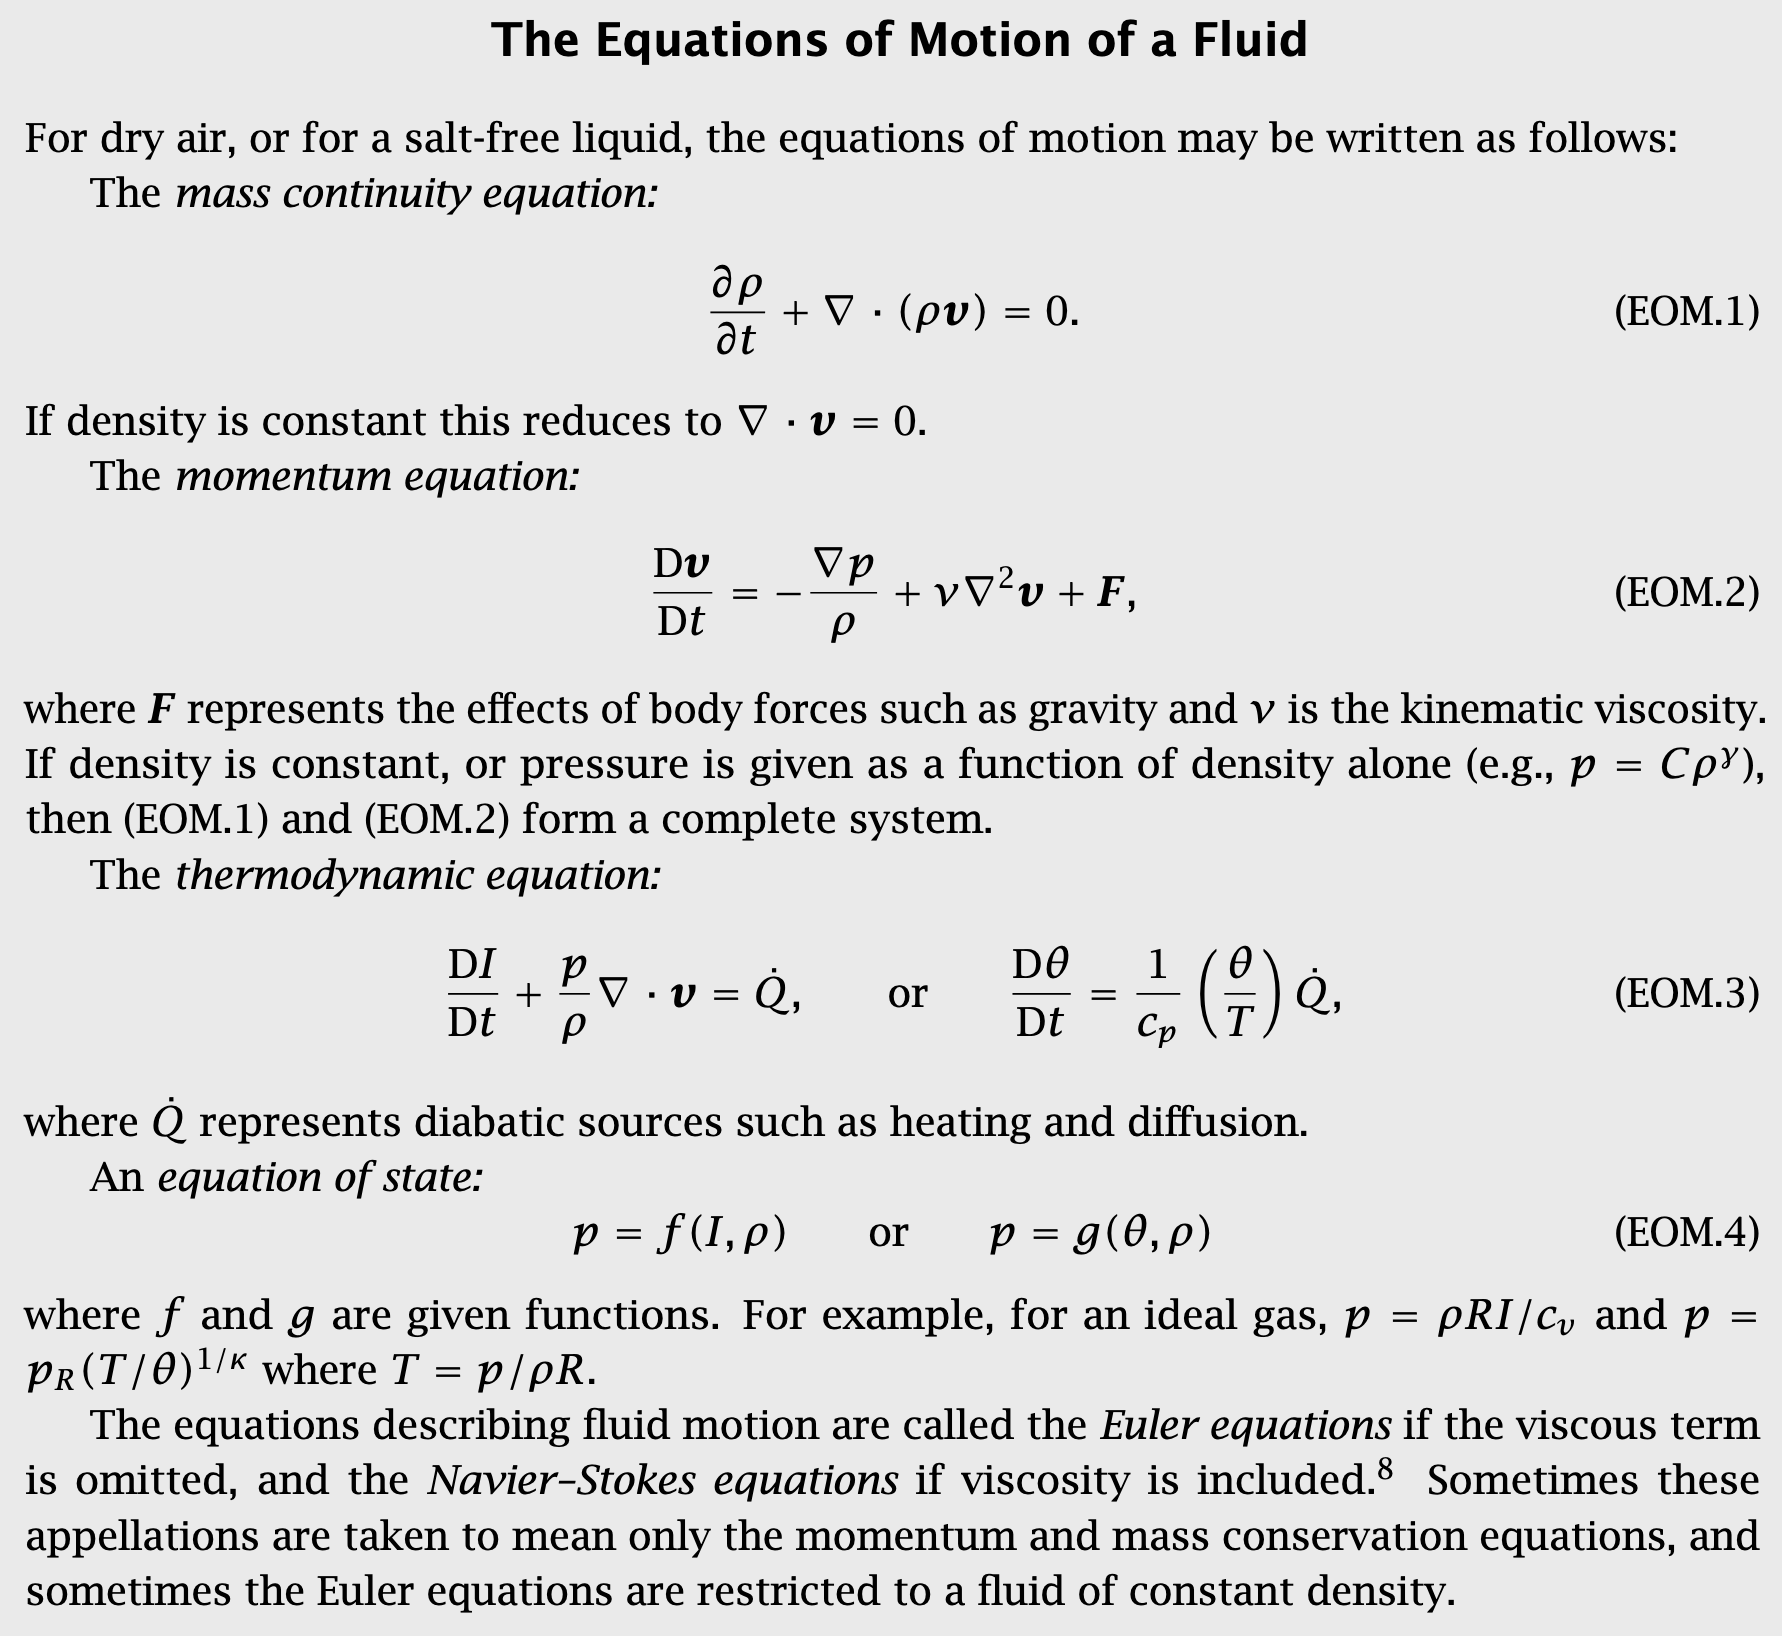
Equations of Motion
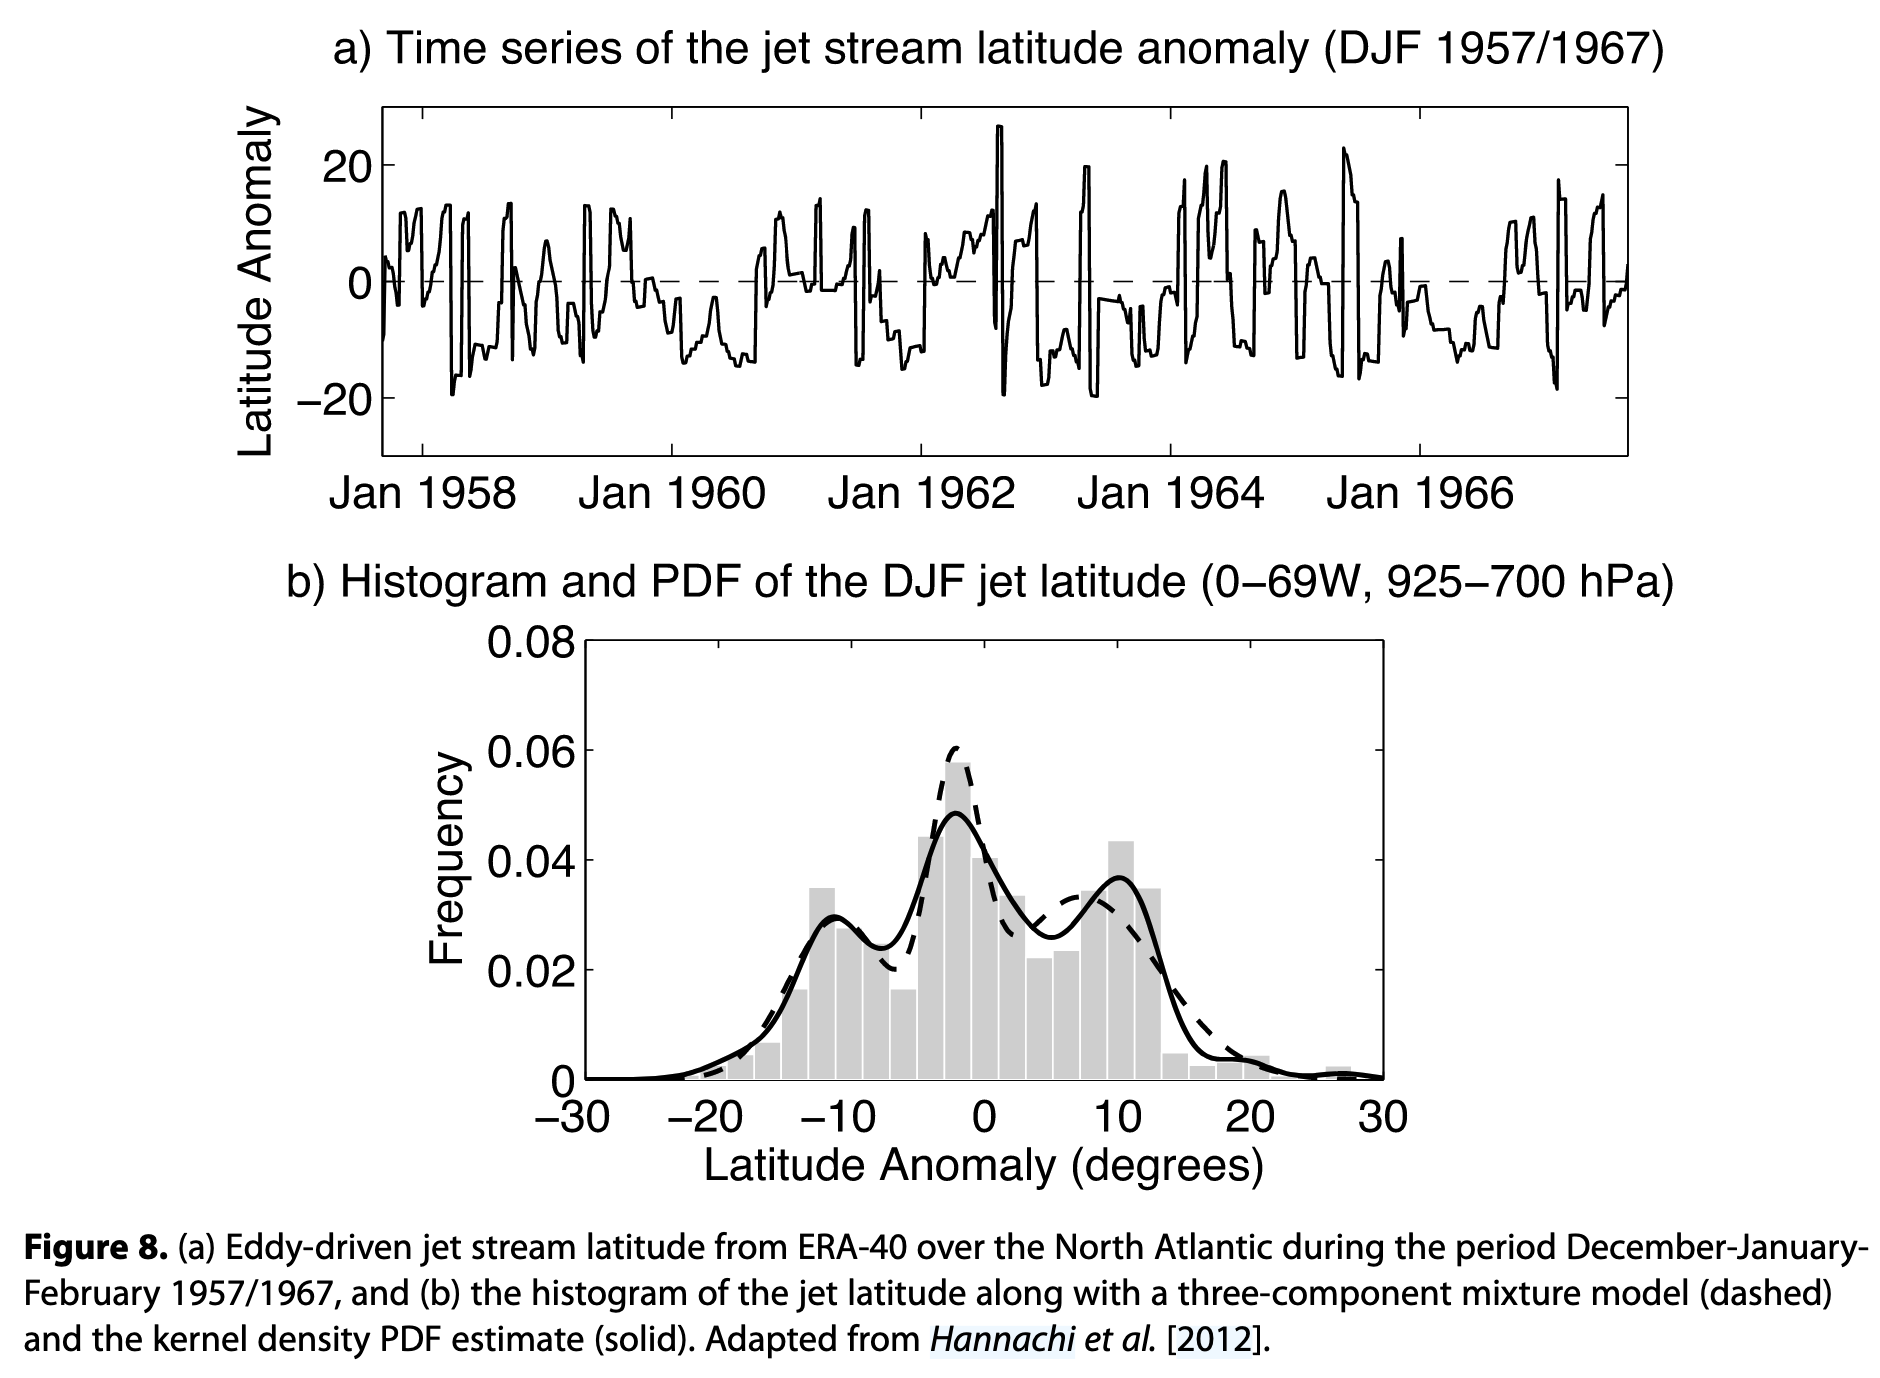
Chaos and regimes
The climate behaves as a nonlinear dynamical system with characteristic modes or regimes.
Billion Dollar Disasters
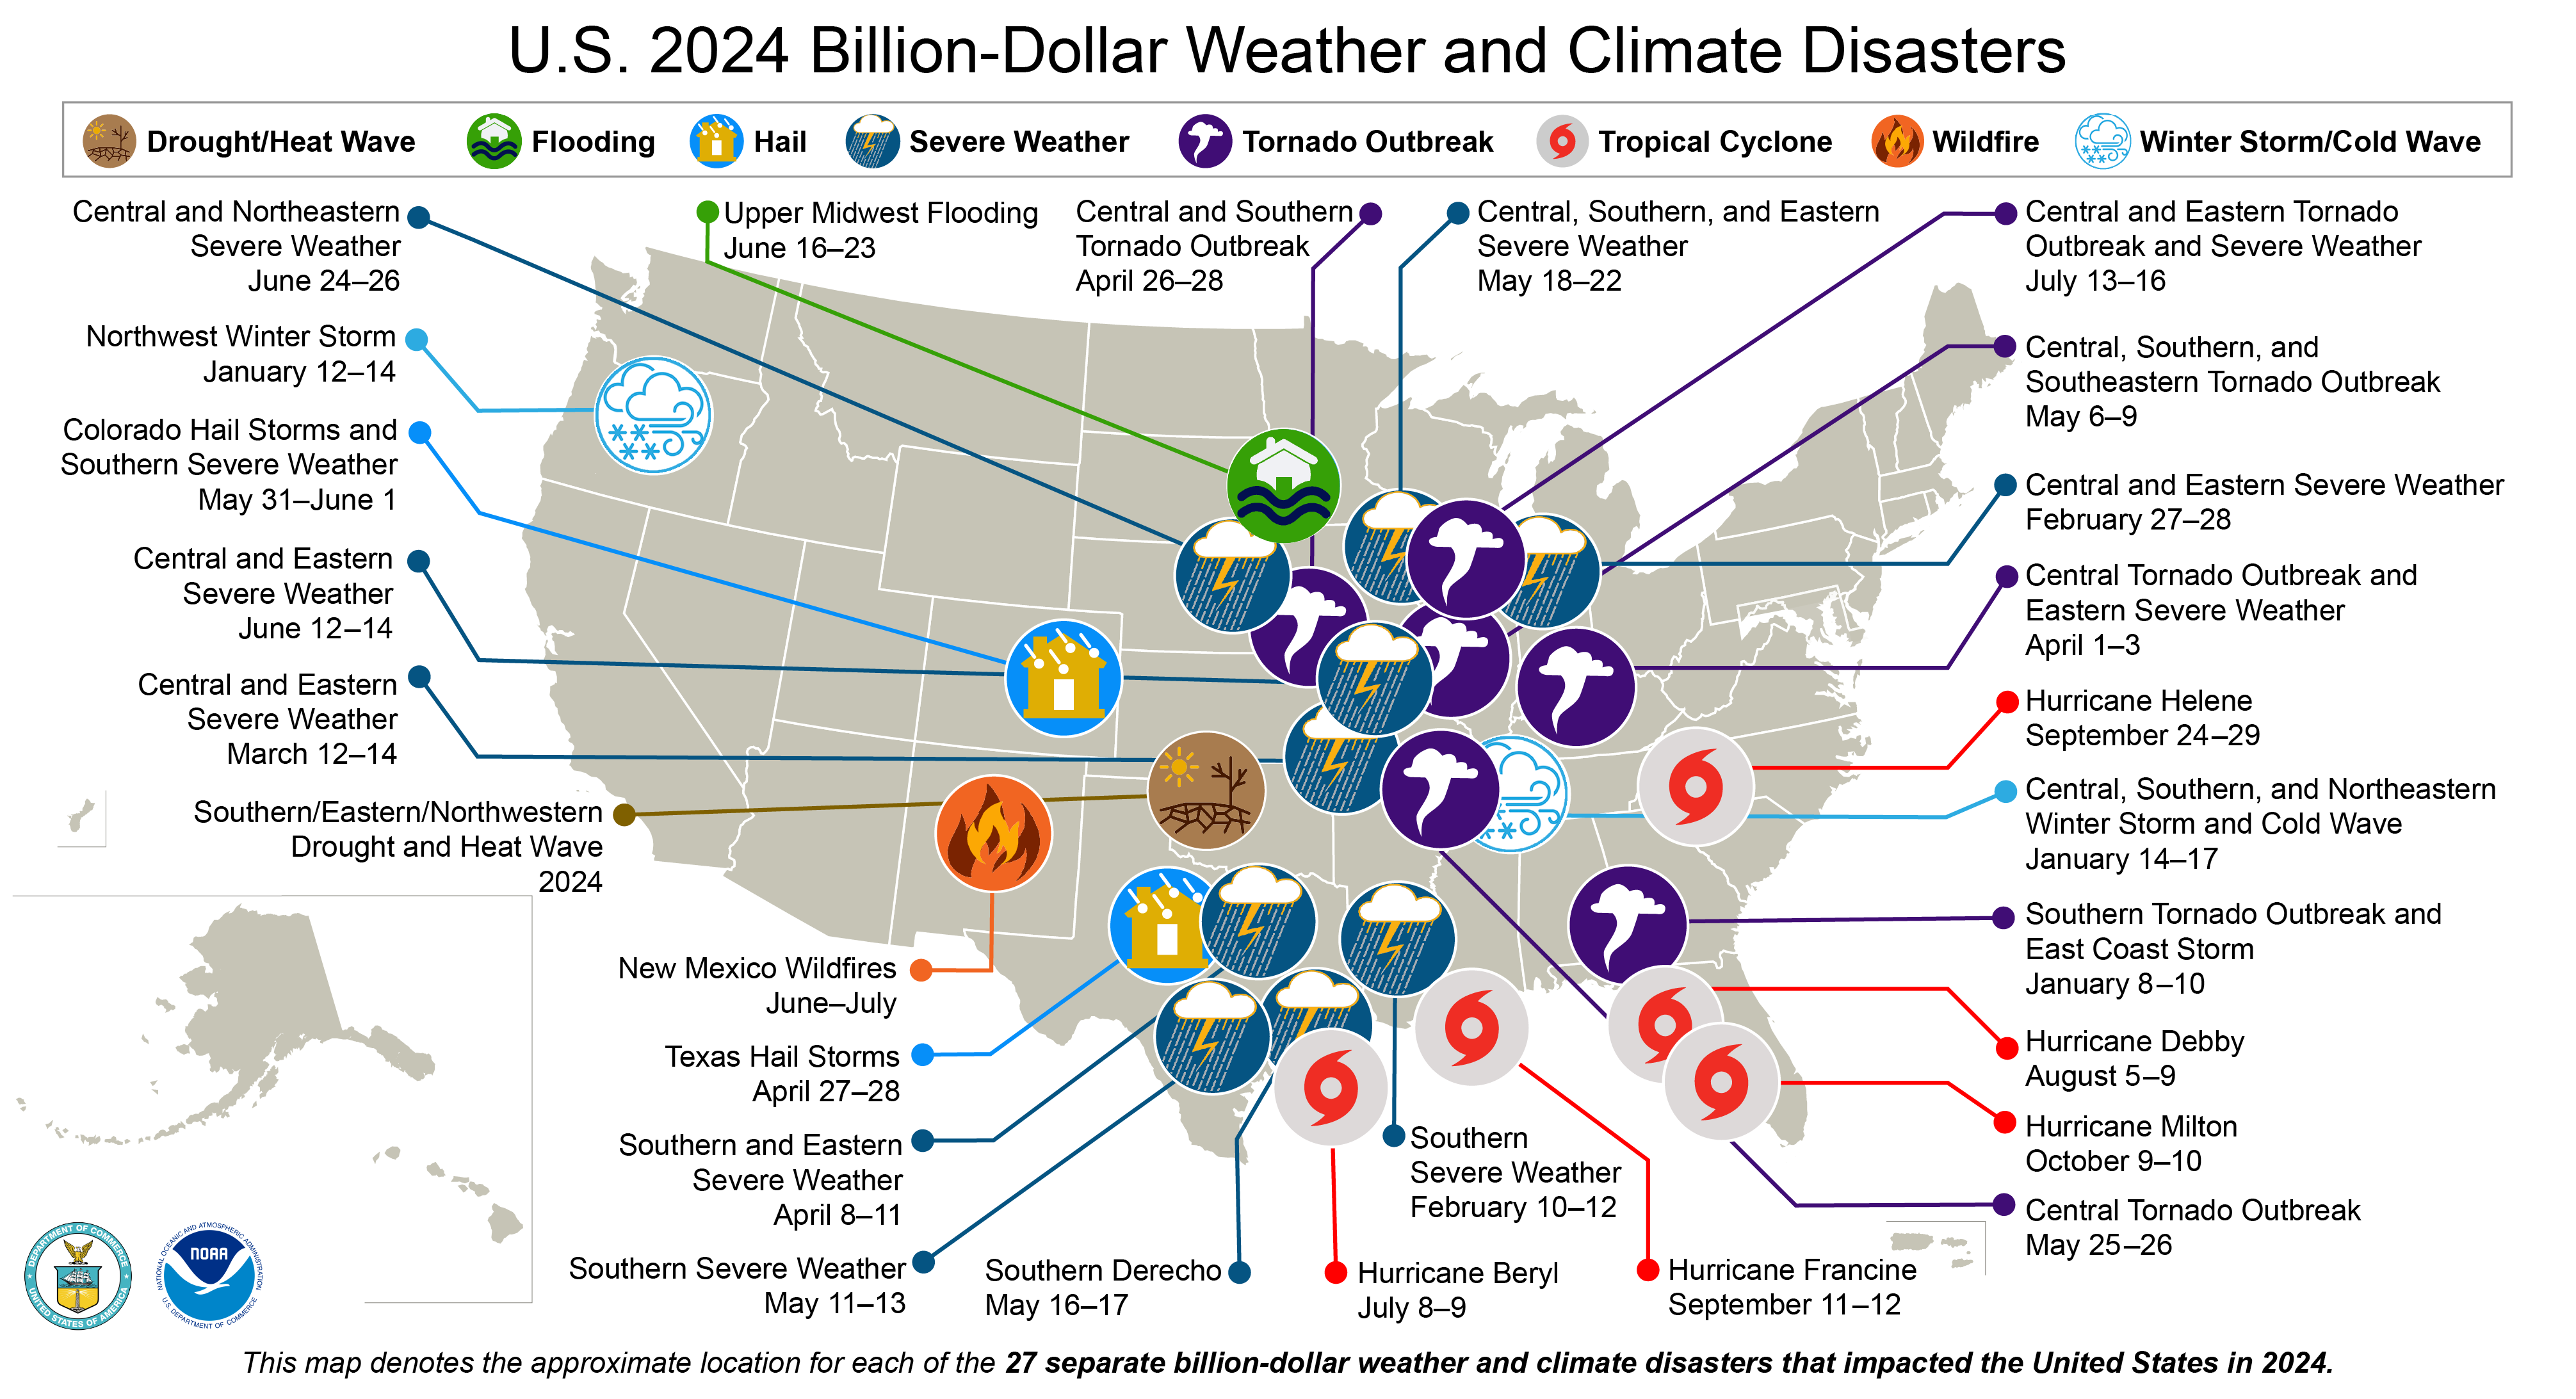
U.S. billion-dollar weather and climate disasters. Source: NOAA NCEI
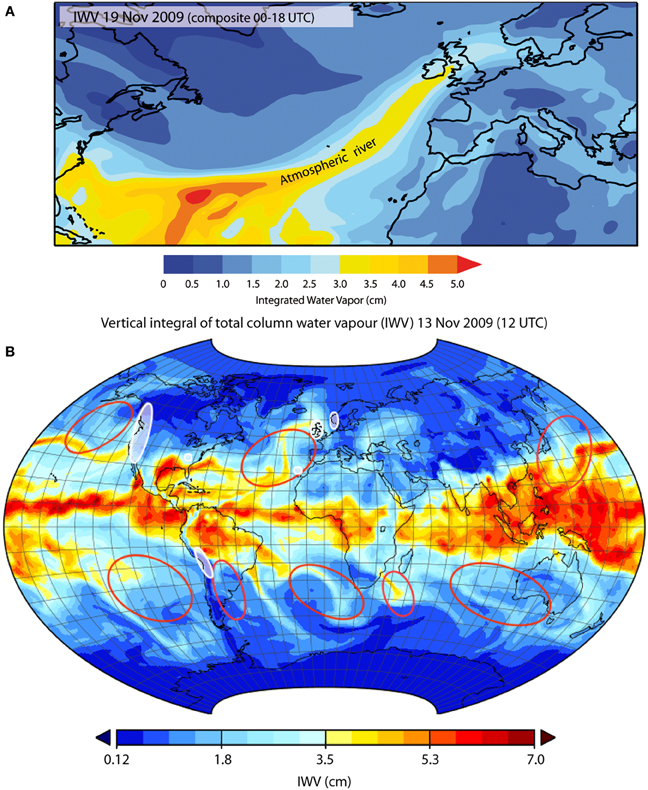
Atmospheric Rivers
Organized moisture transport from warm tropical and subtropical oceans drives a large fraction of midlatitude rainfall.
Tropical Cyclones
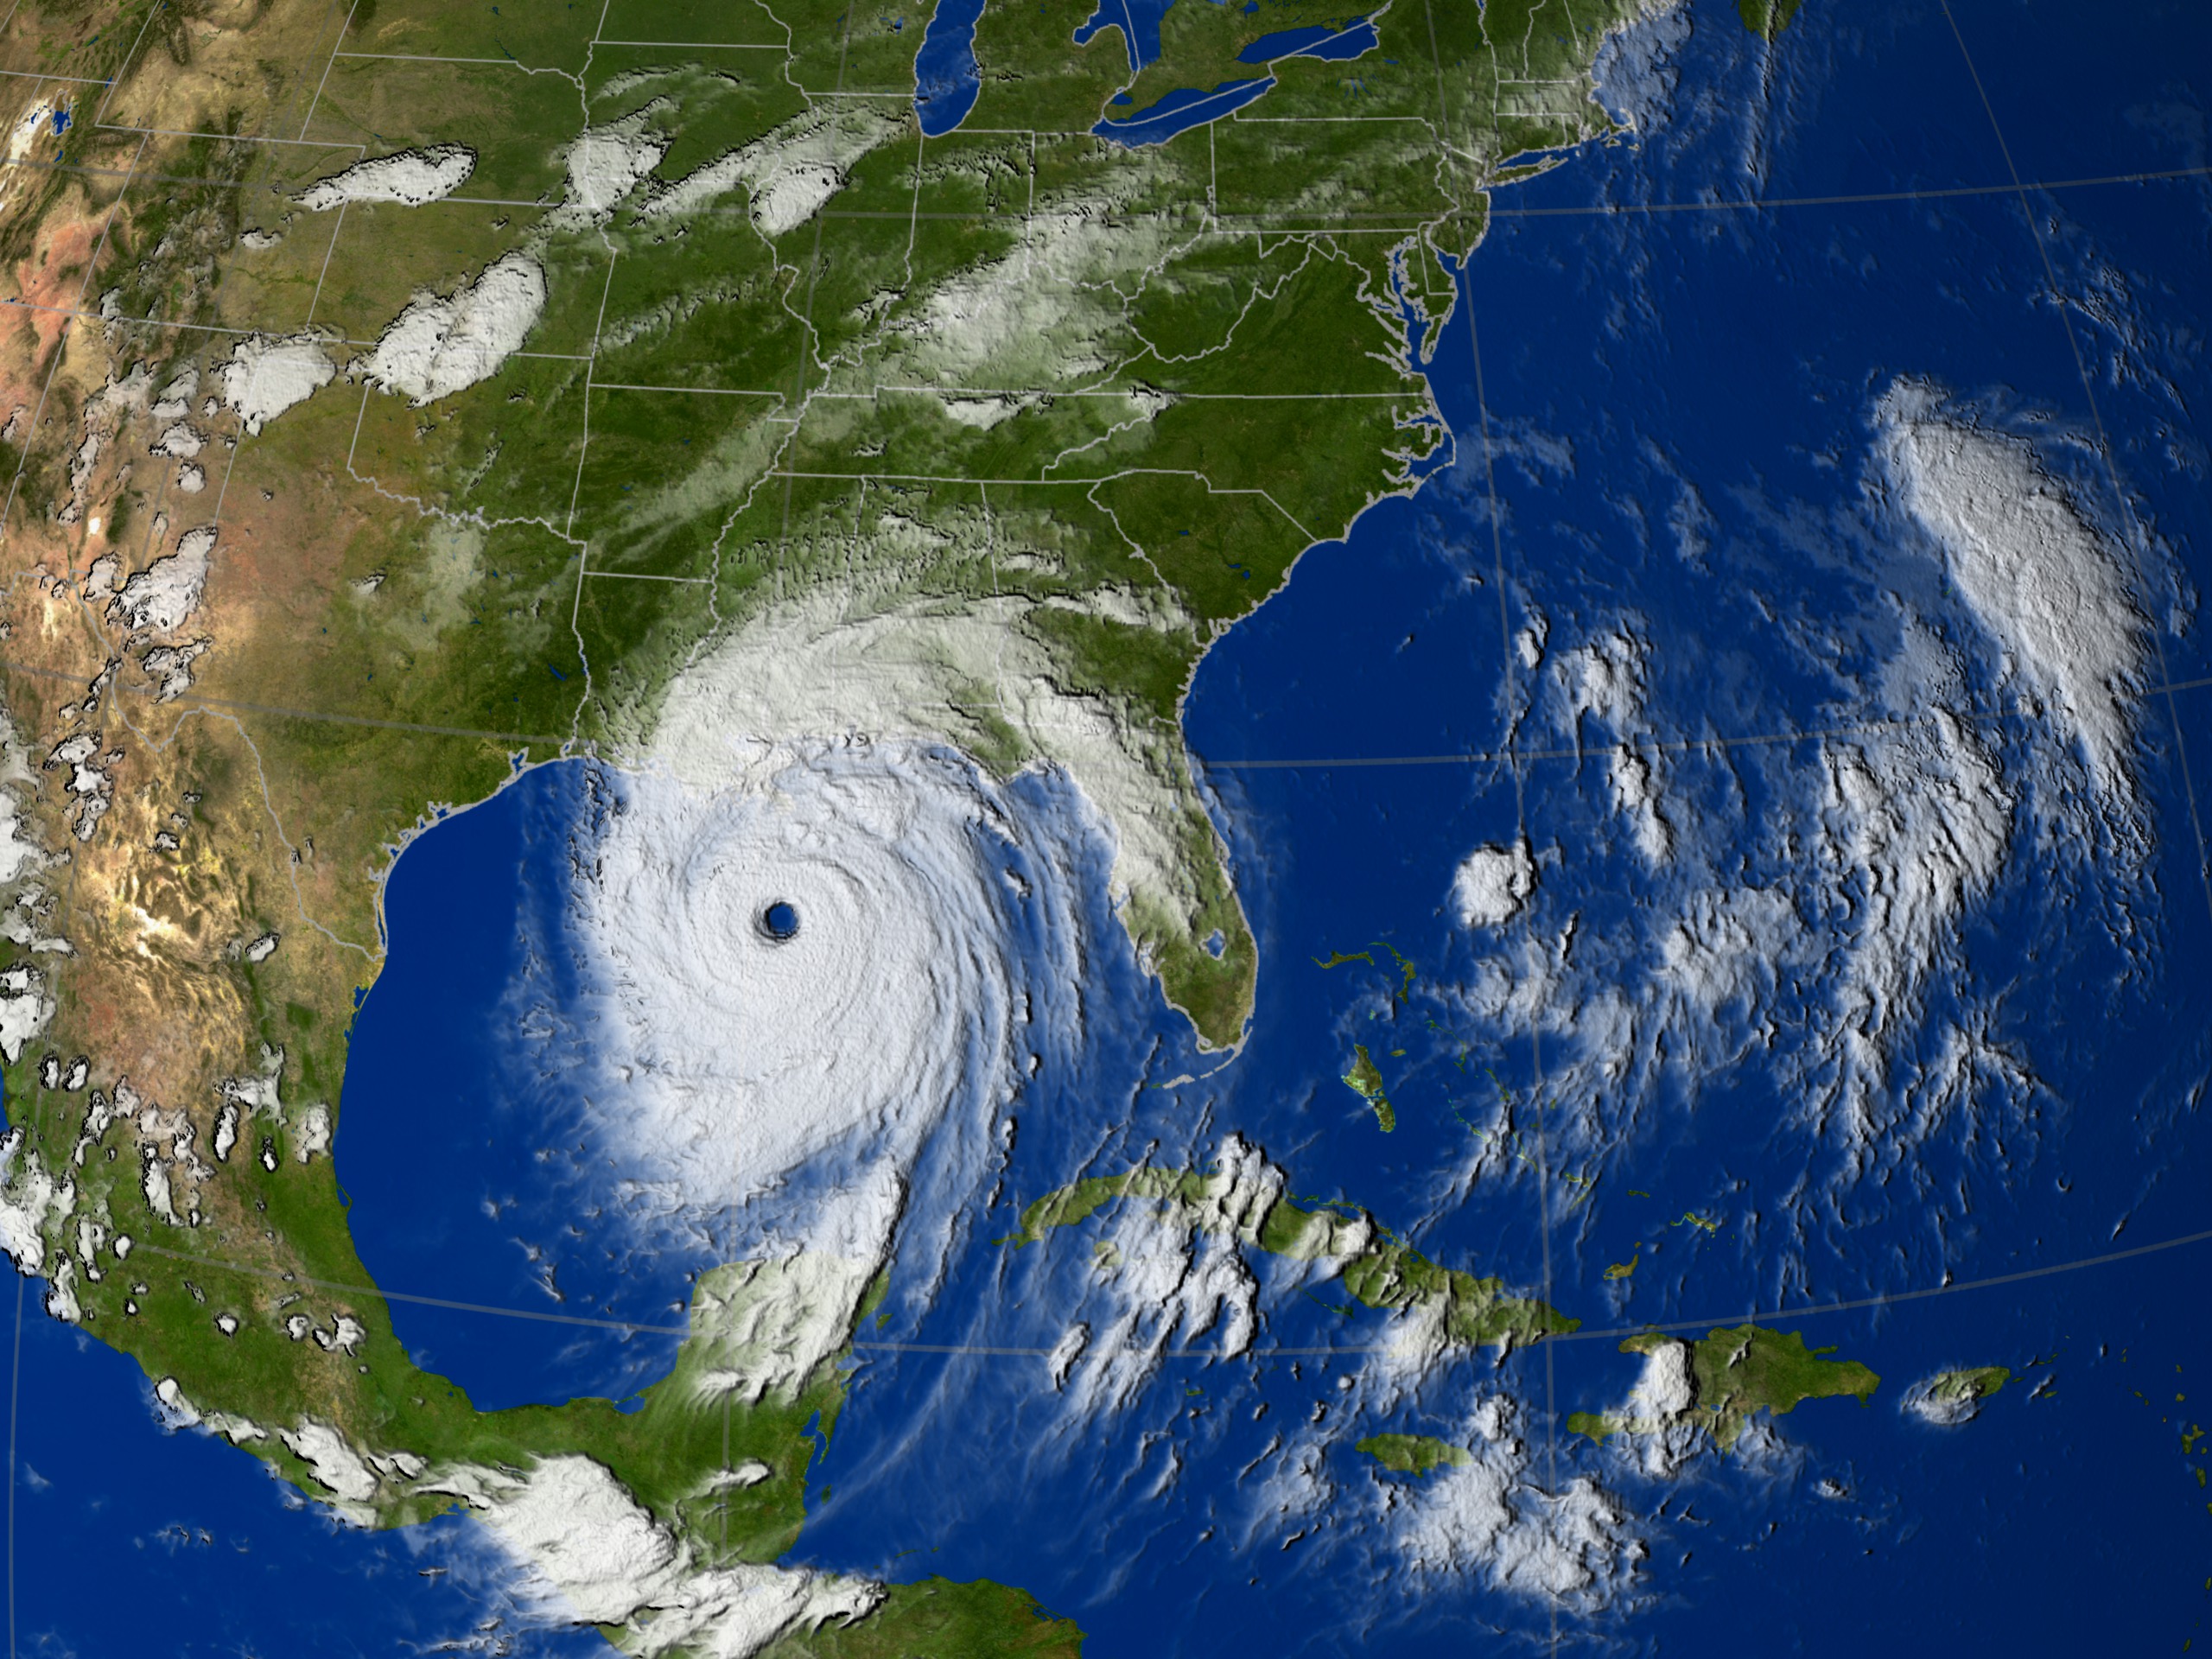
Organized vortices that convert ocean heat to kinetic energy:
- Require warm SSTs (> 26°C) and low wind shear
- Strongest at landfall → storm surge, wind, rainfall
- Examples: Harvey (2017), Maria (2017), Katrina (2005)
Mesoscale Convective Systems
Organized clusters of thunderstorms (10–100 km):
- Persist longer than individual cells
- Responsible for most warm-season extreme rainfall
- Flash floods, derechos, hail
Blocking Patterns
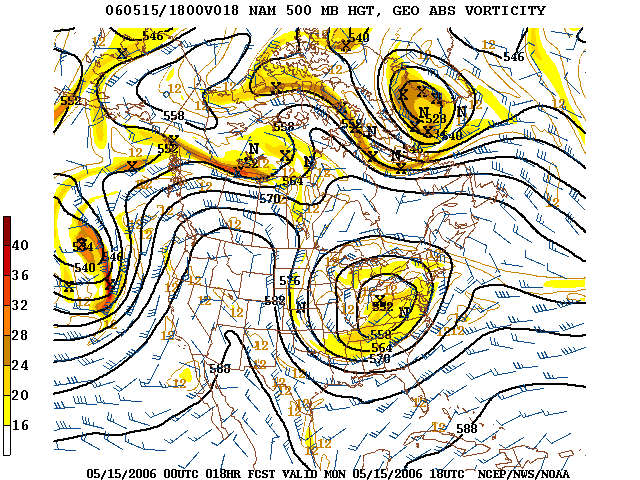
Persistent high-pressure systems that “block” normal flow:
- Divert the jet stream for days to weeks
- Heat waves (2021 Pacific Northwest, 2003 Europe)
- Can also cause persistent cold (Polar vortex disruptions)
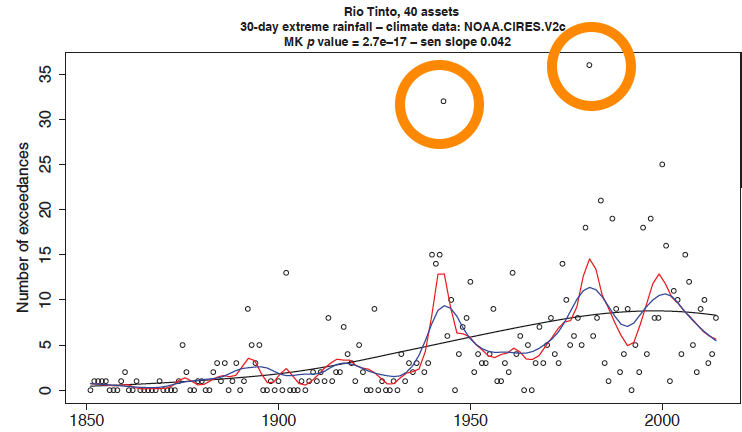
Climate Risks Cluster in Time
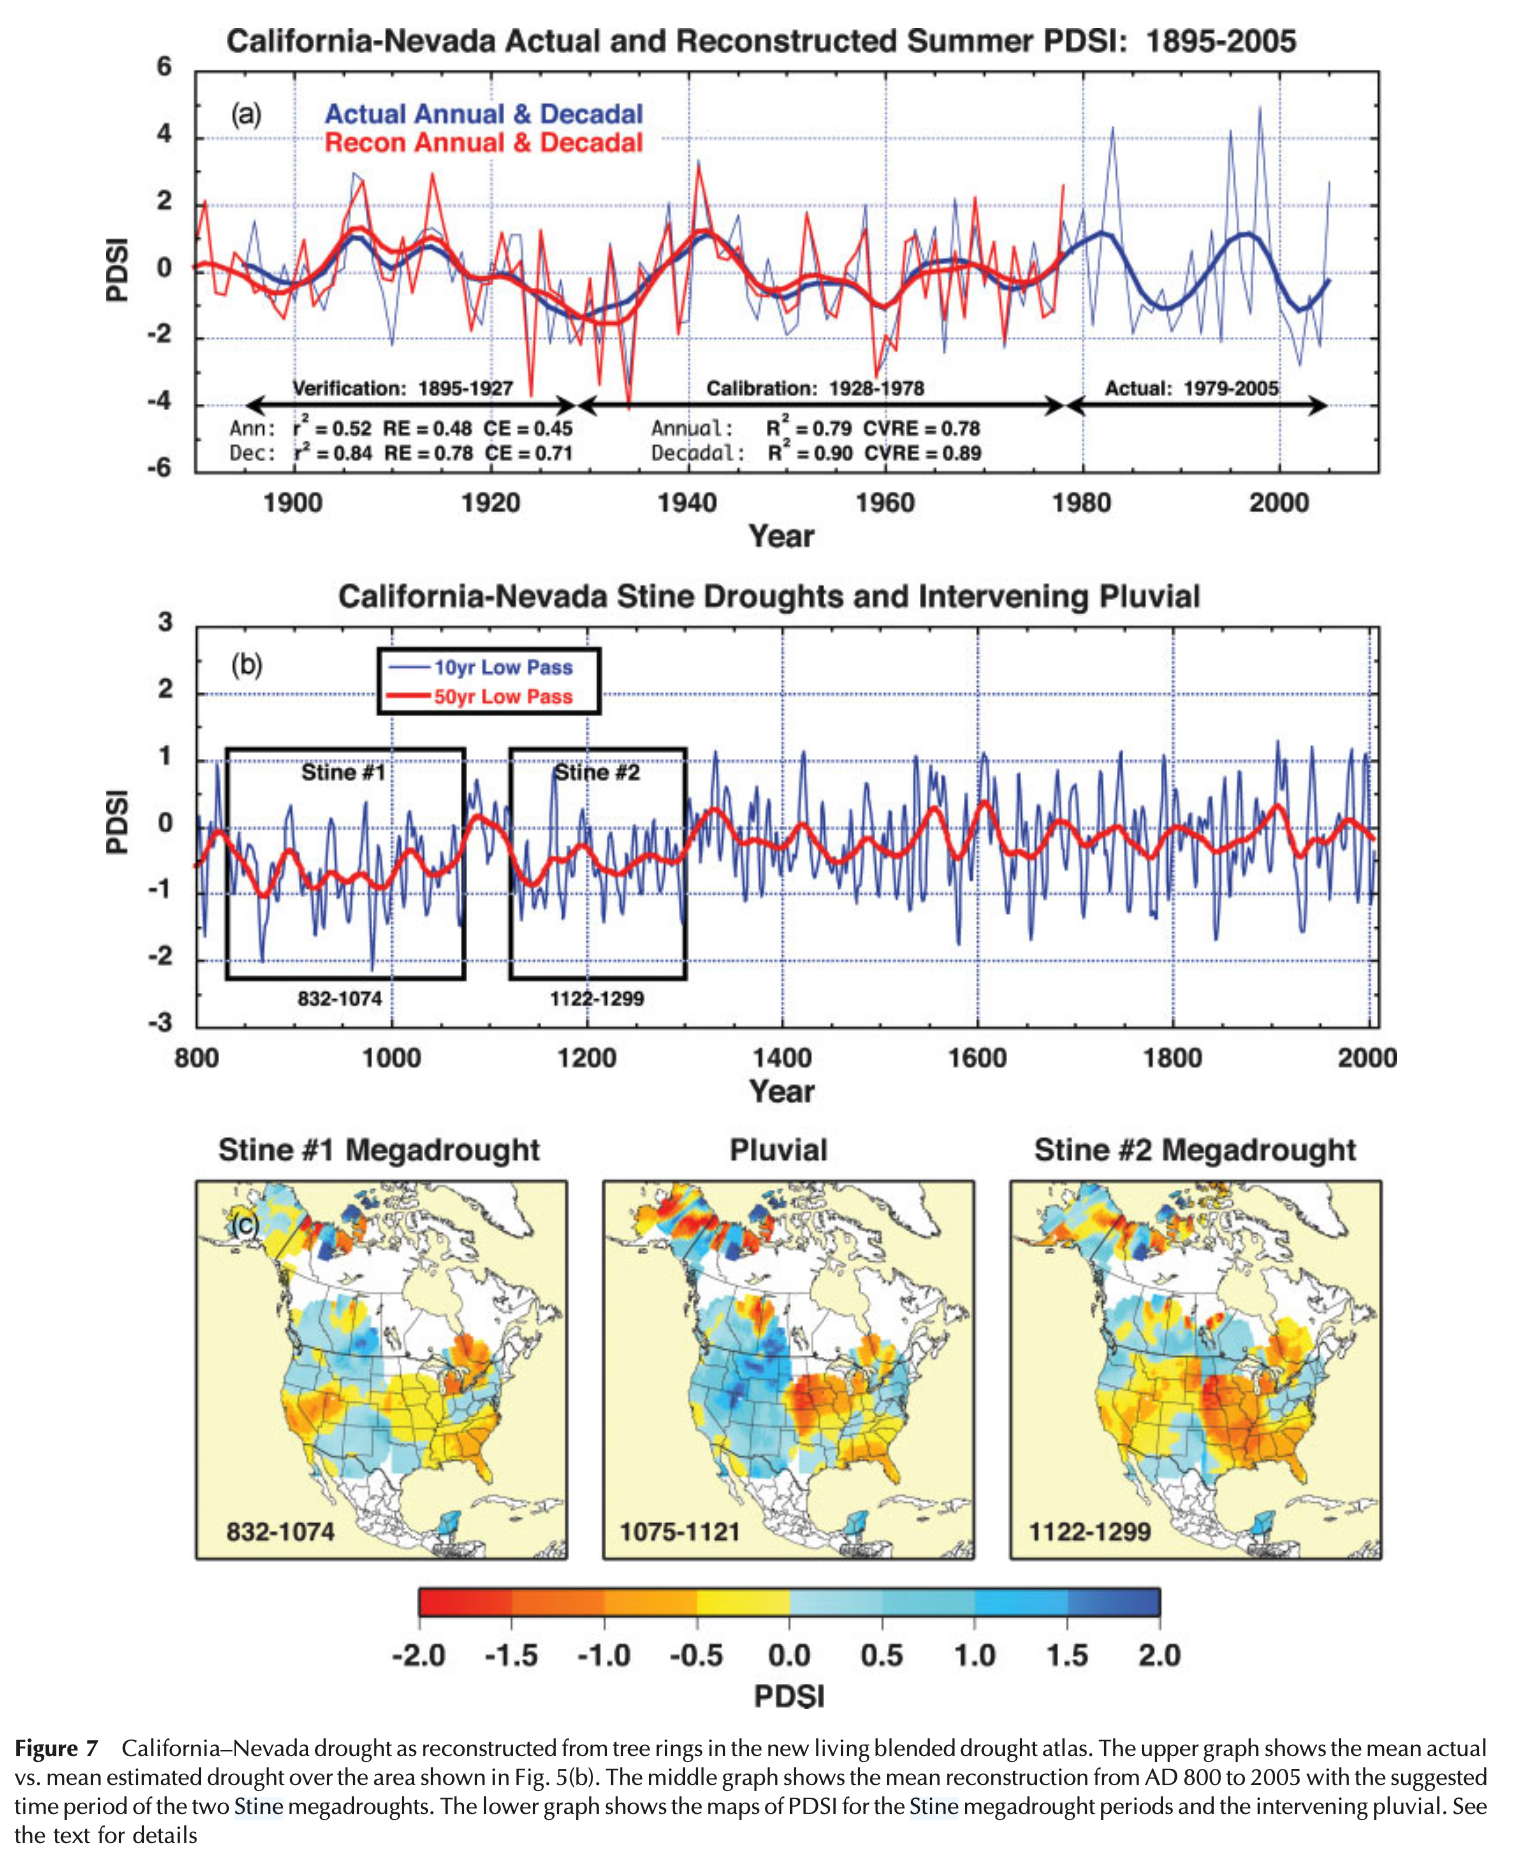
Climate extremes are not independent events.
- Droughts persist for years
- Wet periods cluster together
- Hurricane seasons vary dramatically
Climate Risks Cluster in Space
Extremes are spatially correlated.
- Regional droughts affect portfolios
- Flood losses cluster geographically
- Insurance and infrastructure implications
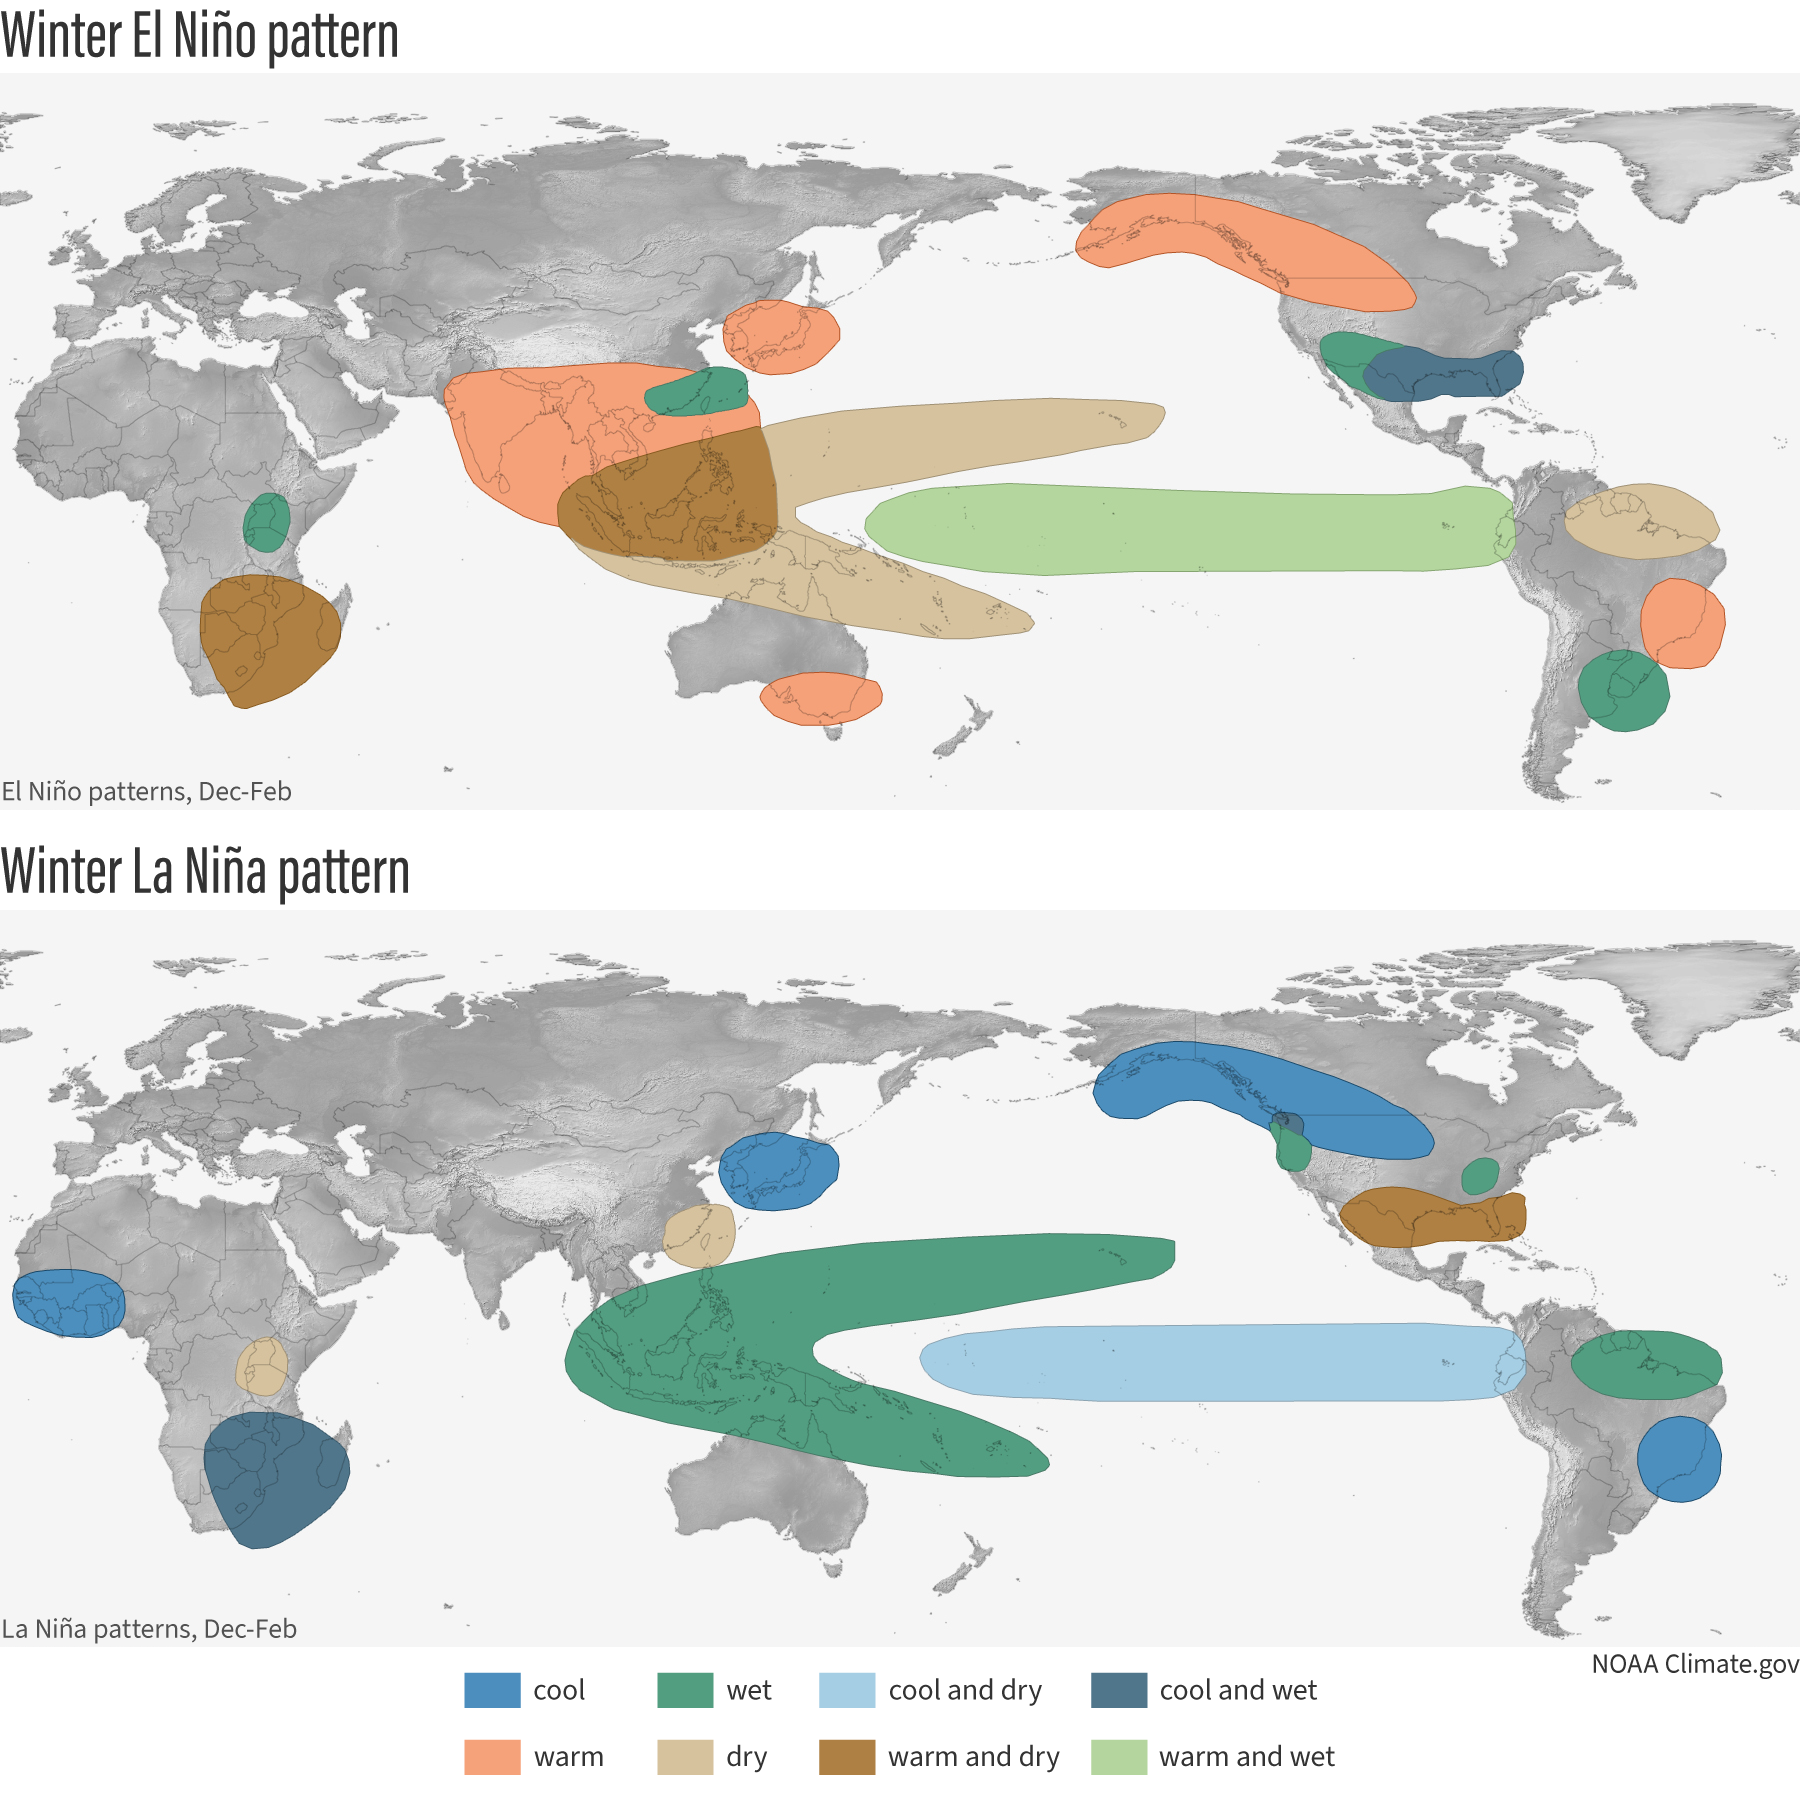
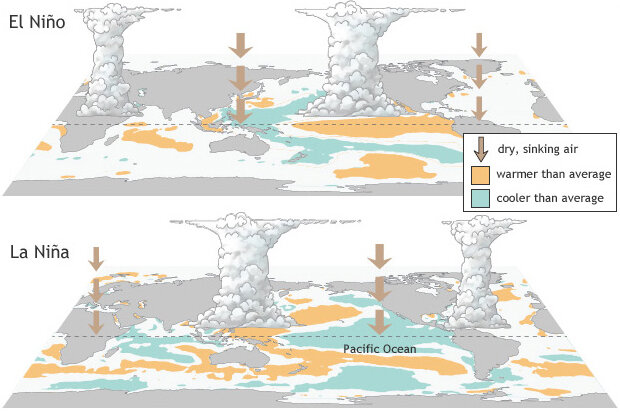
climate.govENSO
The El Niño-Southern Oscillation (ENSO) is the leading mode of variability of the tropical Pacific, with global teleconnections.
climate.govMultiscale Variability
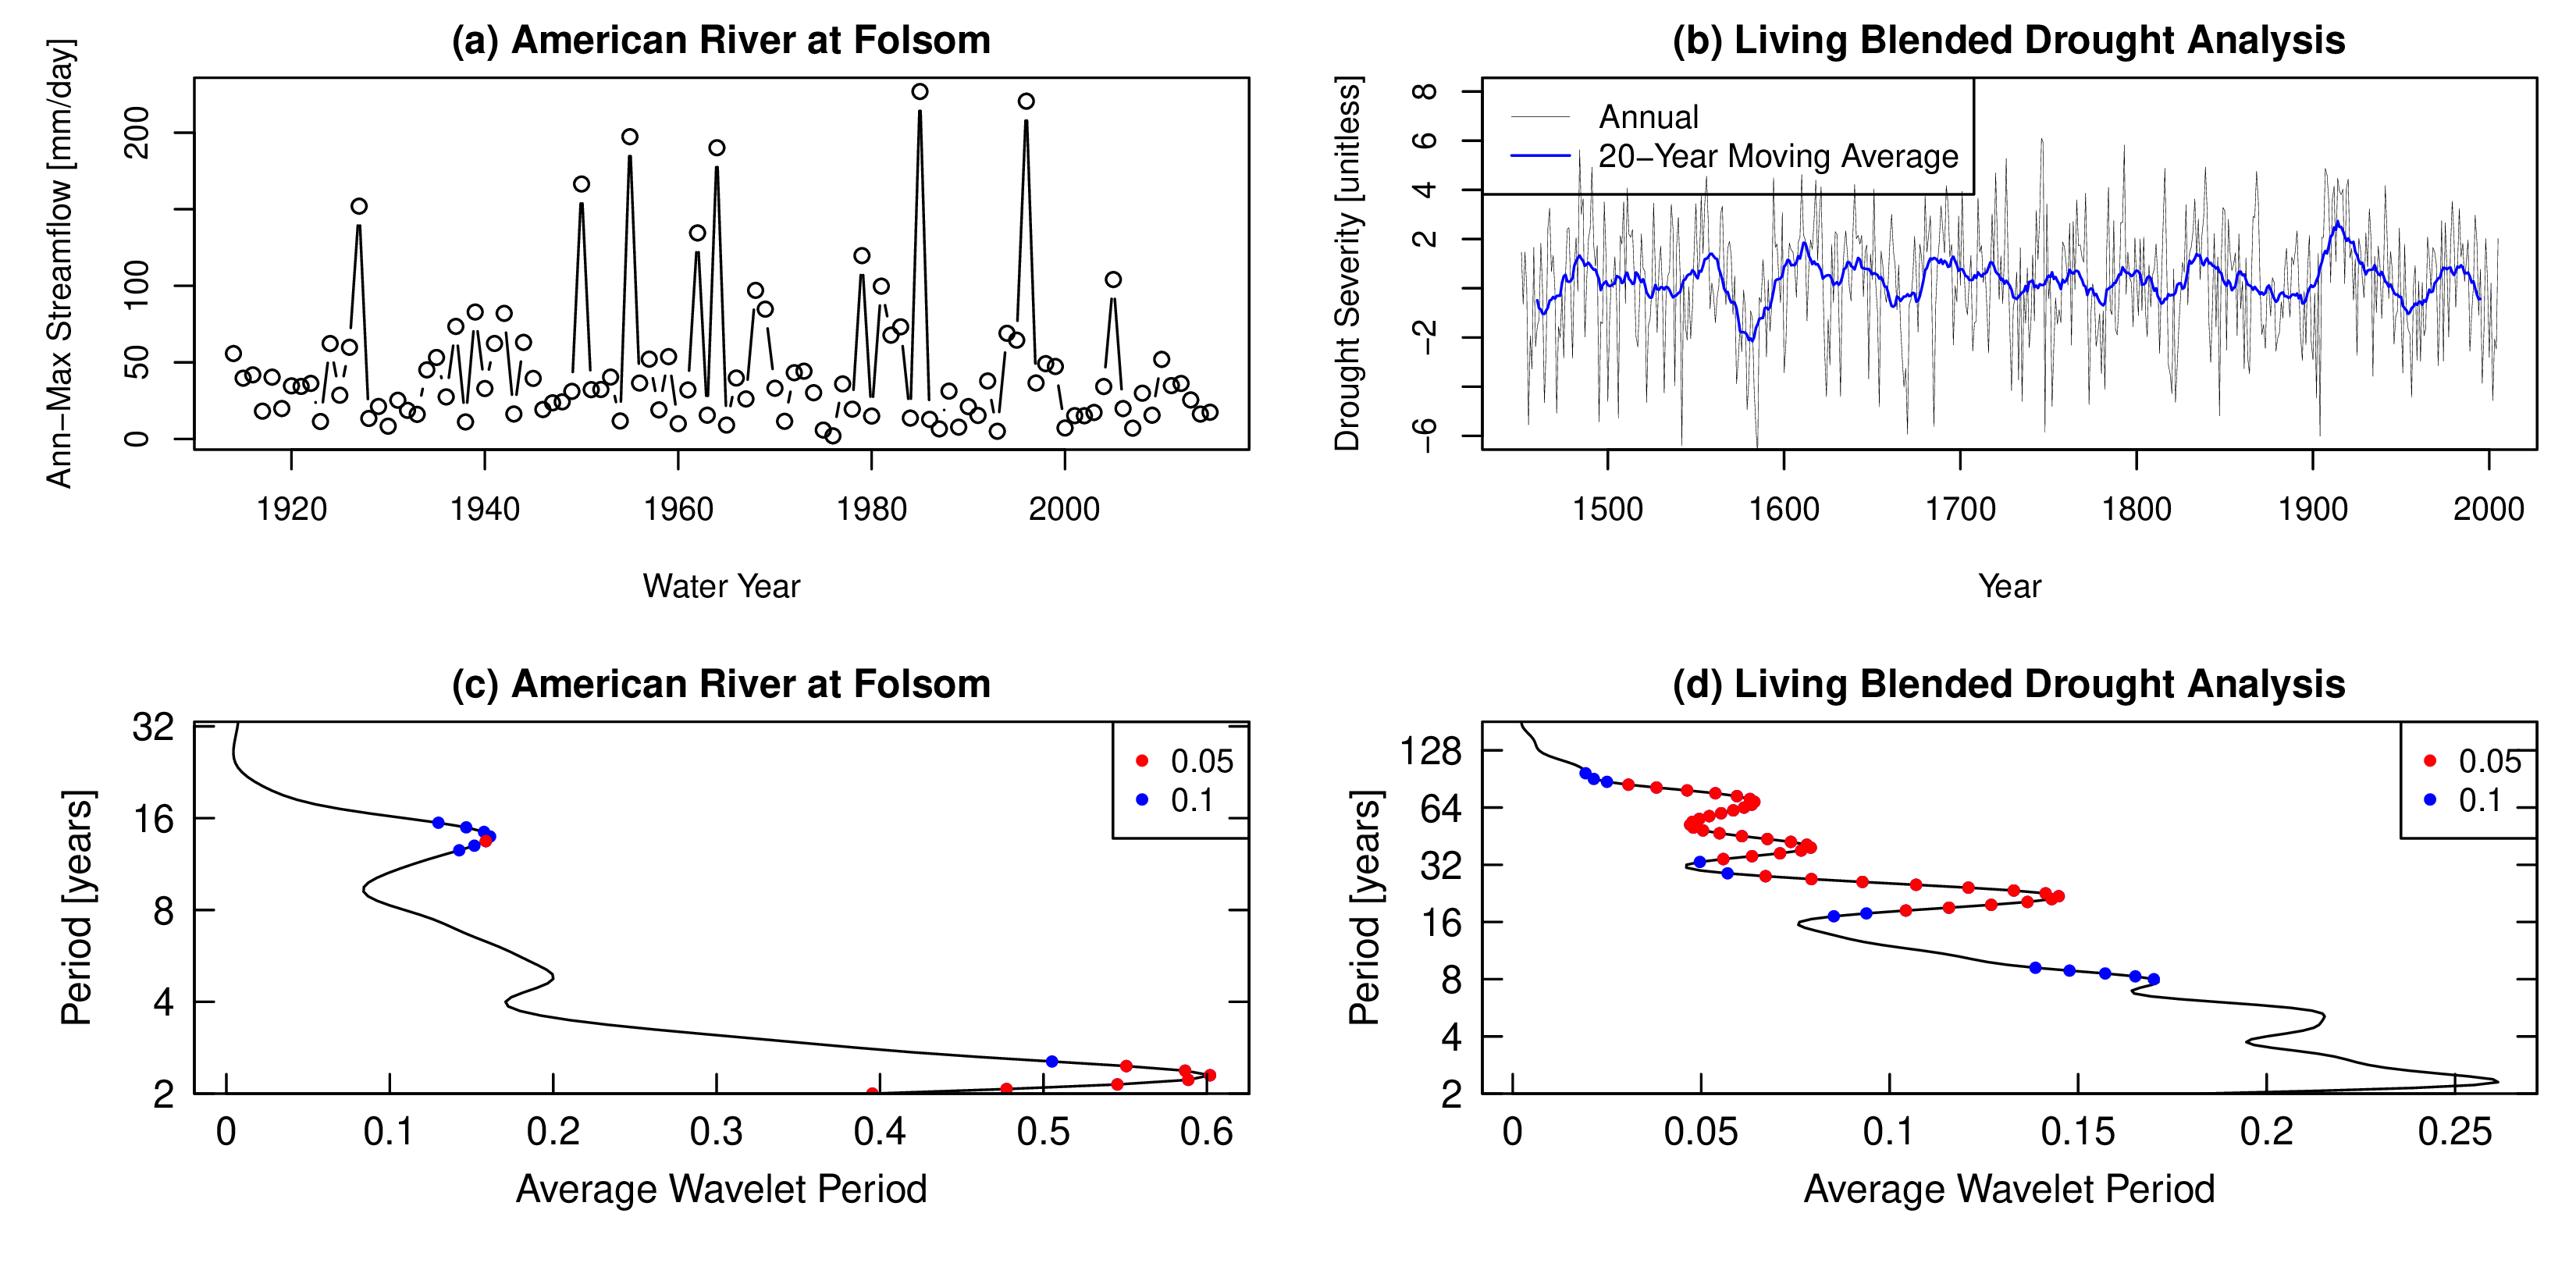
Wavelet analysis reveals variability at multiple timescales. Doss-Gollin et al. (2019)
How GCMs Work
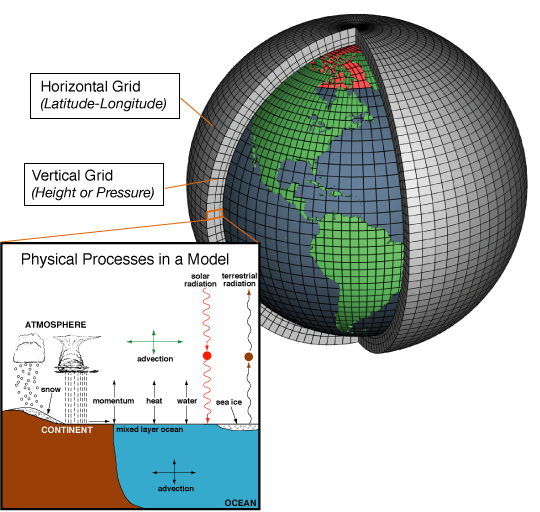
Climate models divide Earth into a 3D grid of cells. Source: NOAA Climate.gov
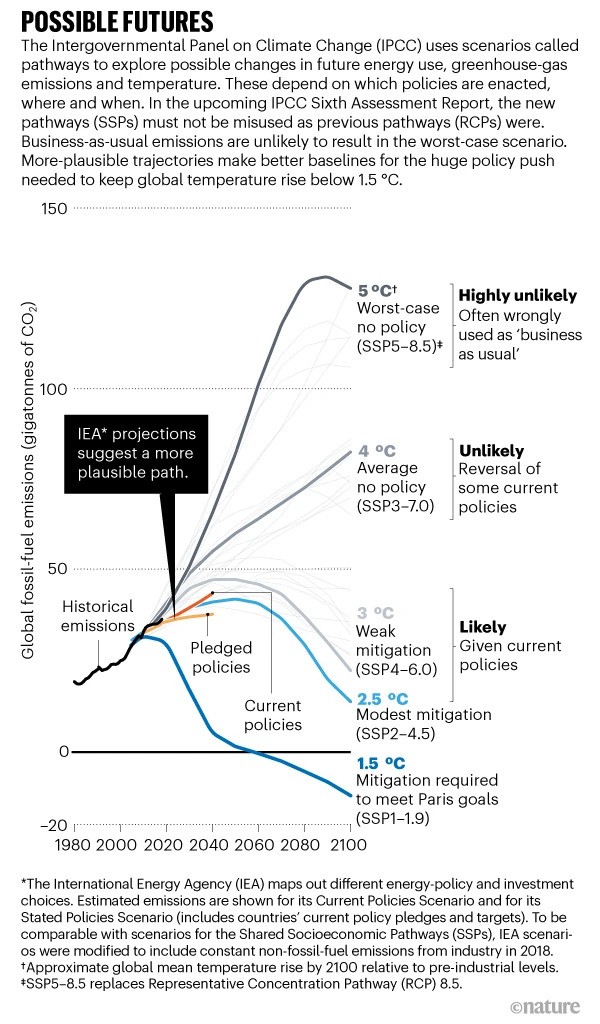
Scenarios Are Not Predictions
- Scenarios are “what if” storylines
- They bracket human choices
- No probabilities attached
Components of Sea Level Rise
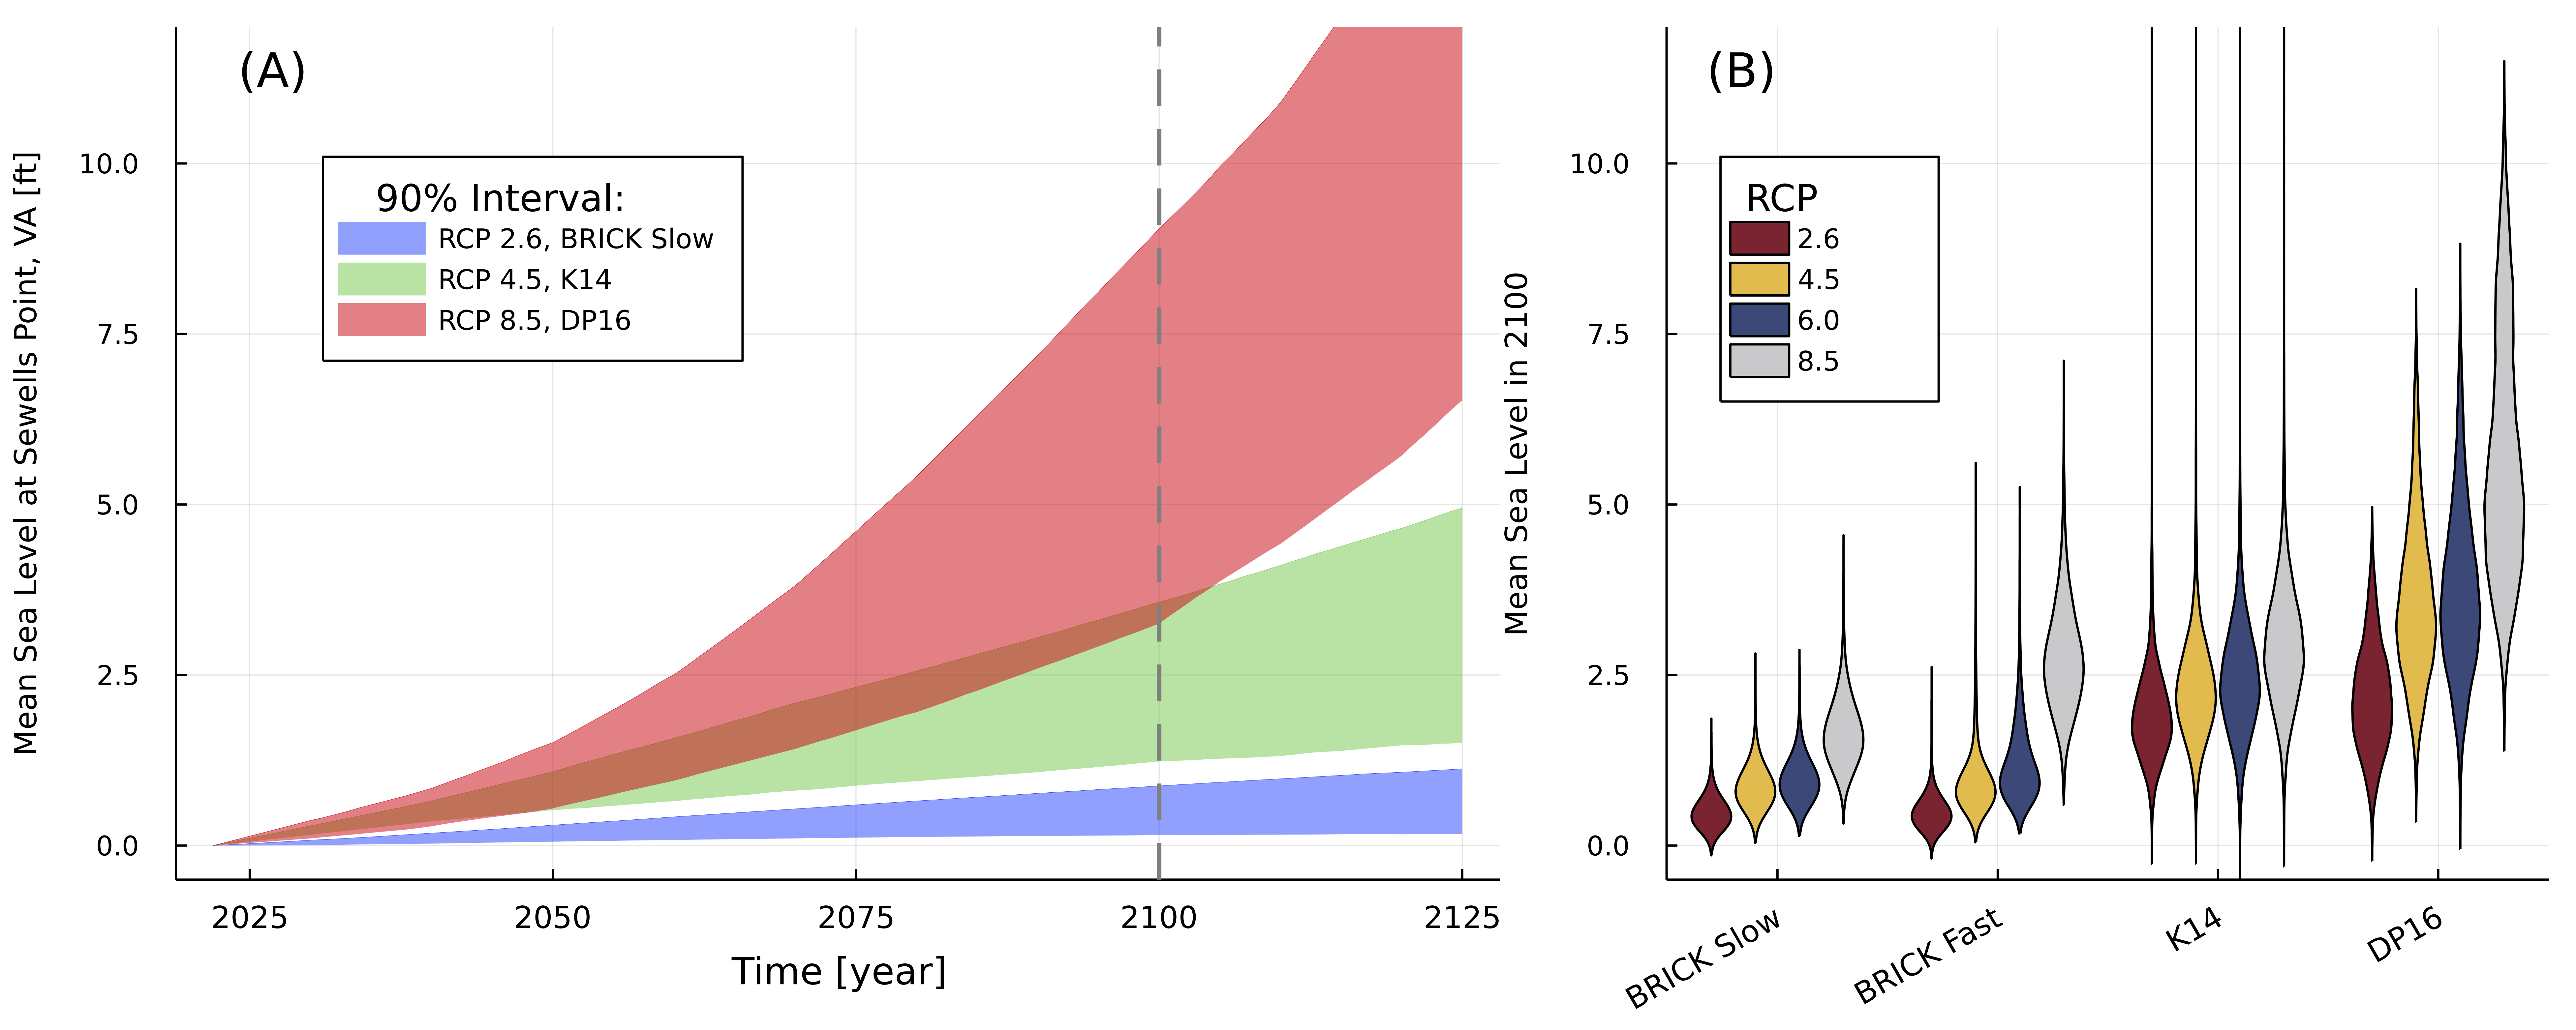
Local sea level is affected by multiple processes. Source: NOAA